Source article

Niewiadomski, M., Drab, A., Piecuch, J., & Tamáš, V. (2025). Education, Skills and the Intensity of Labour Demand: A Comparative Study of EU Countries. European Research Studies Journal, 28(1), 794–808. https://doi.org/10.35808/ersj/3936

Introduction

In contemporary economies, the labour market functions not only as a key mechanism for matching workers with jobs but also as a crucial factor in ensuring macroeconomic stability and individual well-being. Its strategic role derives from its integration with other market systems, including finance, goods, and services. Employers rely on human capital to foster innovation and productivity, while individuals depend on employment to secure economic stability and personal fulfilment. The dynamic character of the labour market reflects ongoing changes in educational attainment, technological advancement, and the evolving expectations of both employers and jobseekers.

Research hypothesis: the changes that have occurred on the labour market in recent years are reducing demand from businesses for employees with higher education.

Intensity of labour demand – visualisation

The charts below illustrate selected trends in the intensity of labour demand (ILD3) between 2010 and 2023, with particular focus on education levels and occupational structures based on the ISCED and ISCO-08 classifications. All figures have been independently developed by the authors using original data processed with the ILD3 indicator methodology.

Labour demand visualisation – higher education
Figure 1

Figure 1. Labour demand (ILD3) – Austria, higher education.

Figure 2

Figure 2. Labour demand (ILD3) – Belgium, higher education.

Figure 3

Figure 3. Labour demand (ILD3) – Bulgaria, higher education.

Figure 4

Figure 4. Labour demand (ILD3) – Croatia, higher education.

Figure 5

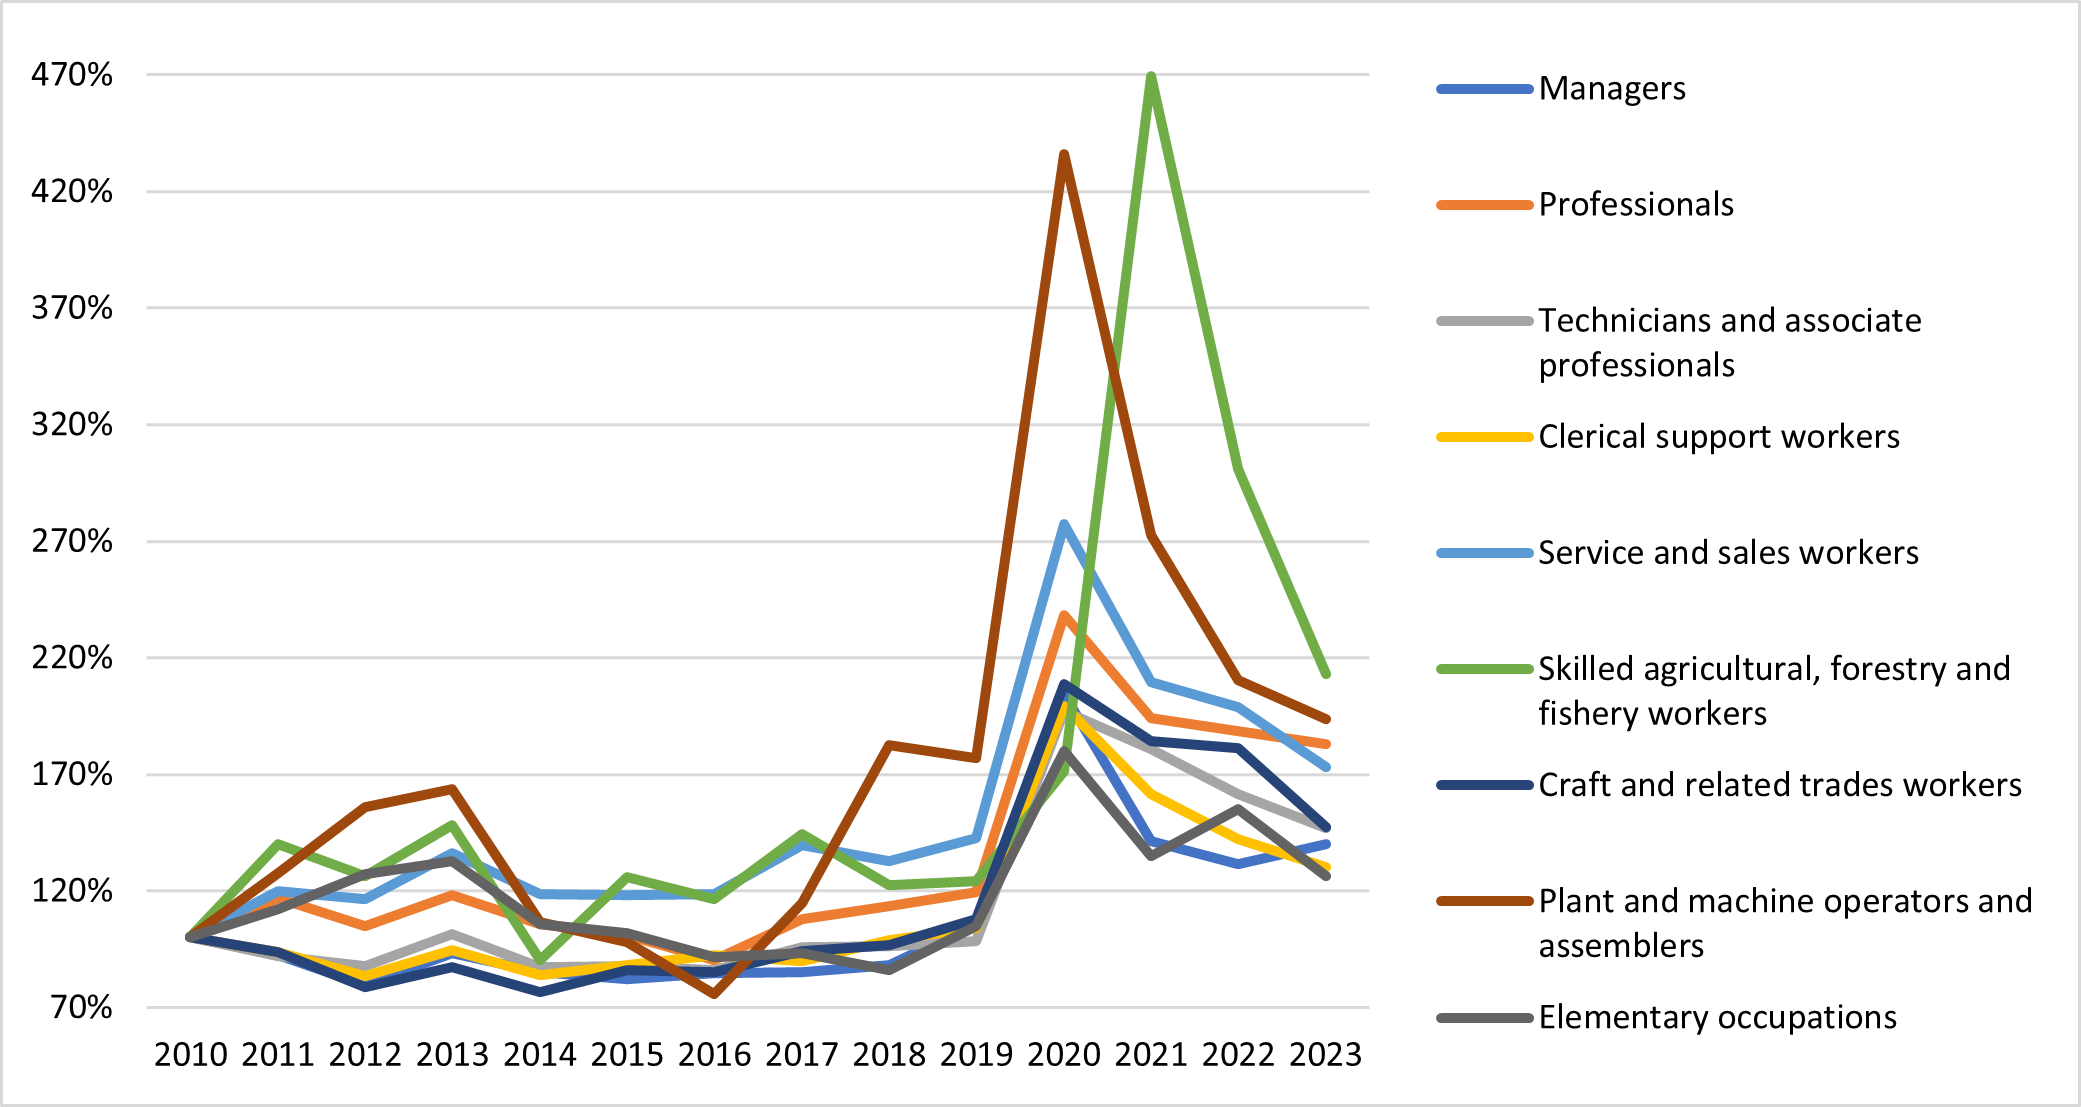
Figure 5. Labour demand (ILD3) – Cyprus, higher education.

Figure 6

Figure 6. Labour demand (ILD3) – Czechia, higher education.

Figure 7

Figure 7. Labour demand (ILD3) – Denmark, higher education.

Figure 8

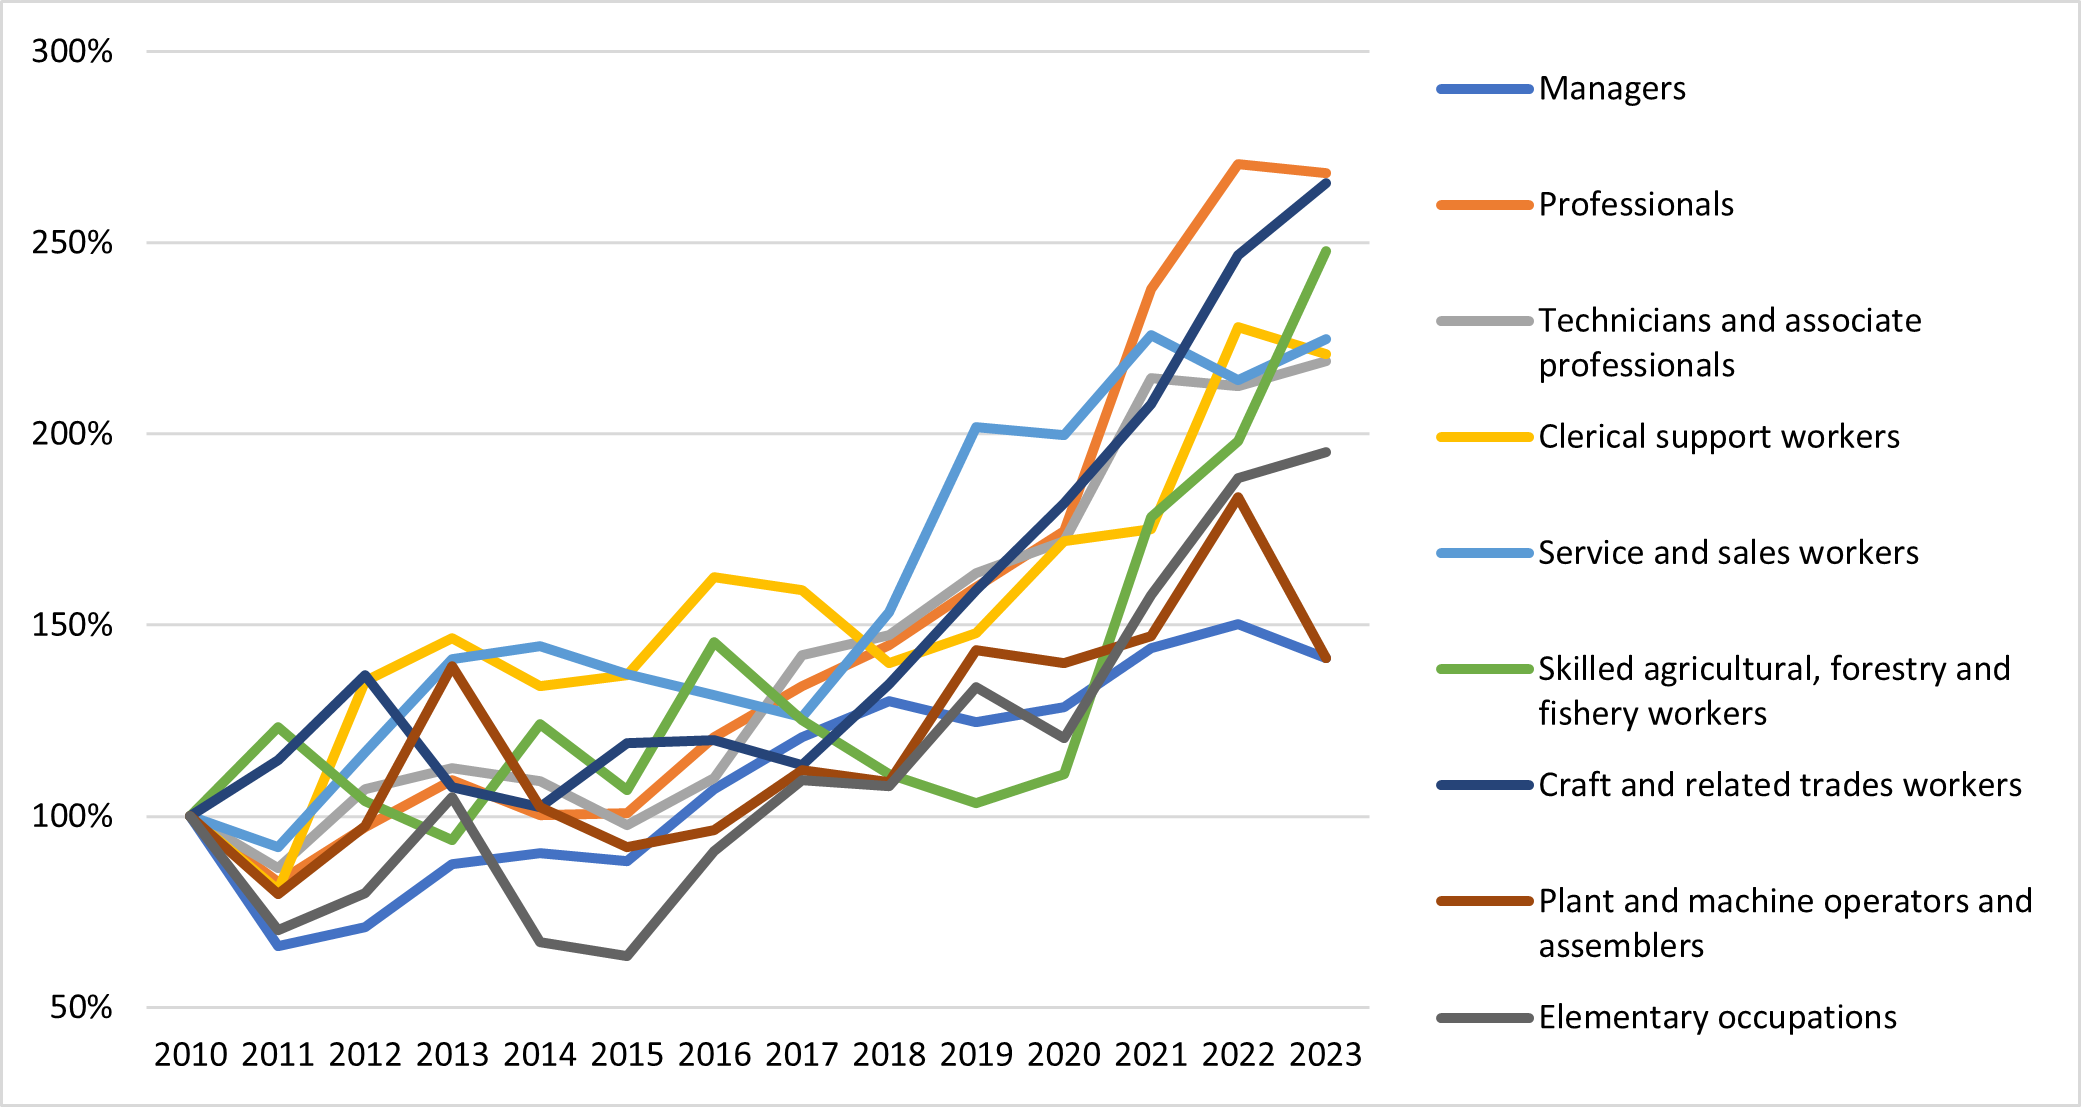
Figure 8. Labour demand (ILD3) – Estonia, higher education.

Figure 9

Figure 9. Labour demand (ILD3) – Finland, higher education.

Figure 10

Figure 10. Labour demand (ILD3) – France, higher education.

Figure 11

Figure 11. Labour demand (ILD3) – Germany, higher education.

Figure 12

Figure 12. Labour demand (ILD3) – Hungary, higher education.

Figure 13

Figure 13. Labour demand (ILD3) – Ireland, higher education.

Figure 14

Figure 14. Labour demand (ILD3) – Italy, higher education.

Figure 15

Figure 15. Labour demand (ILD3) – Latvia, higher education.

Figure 16

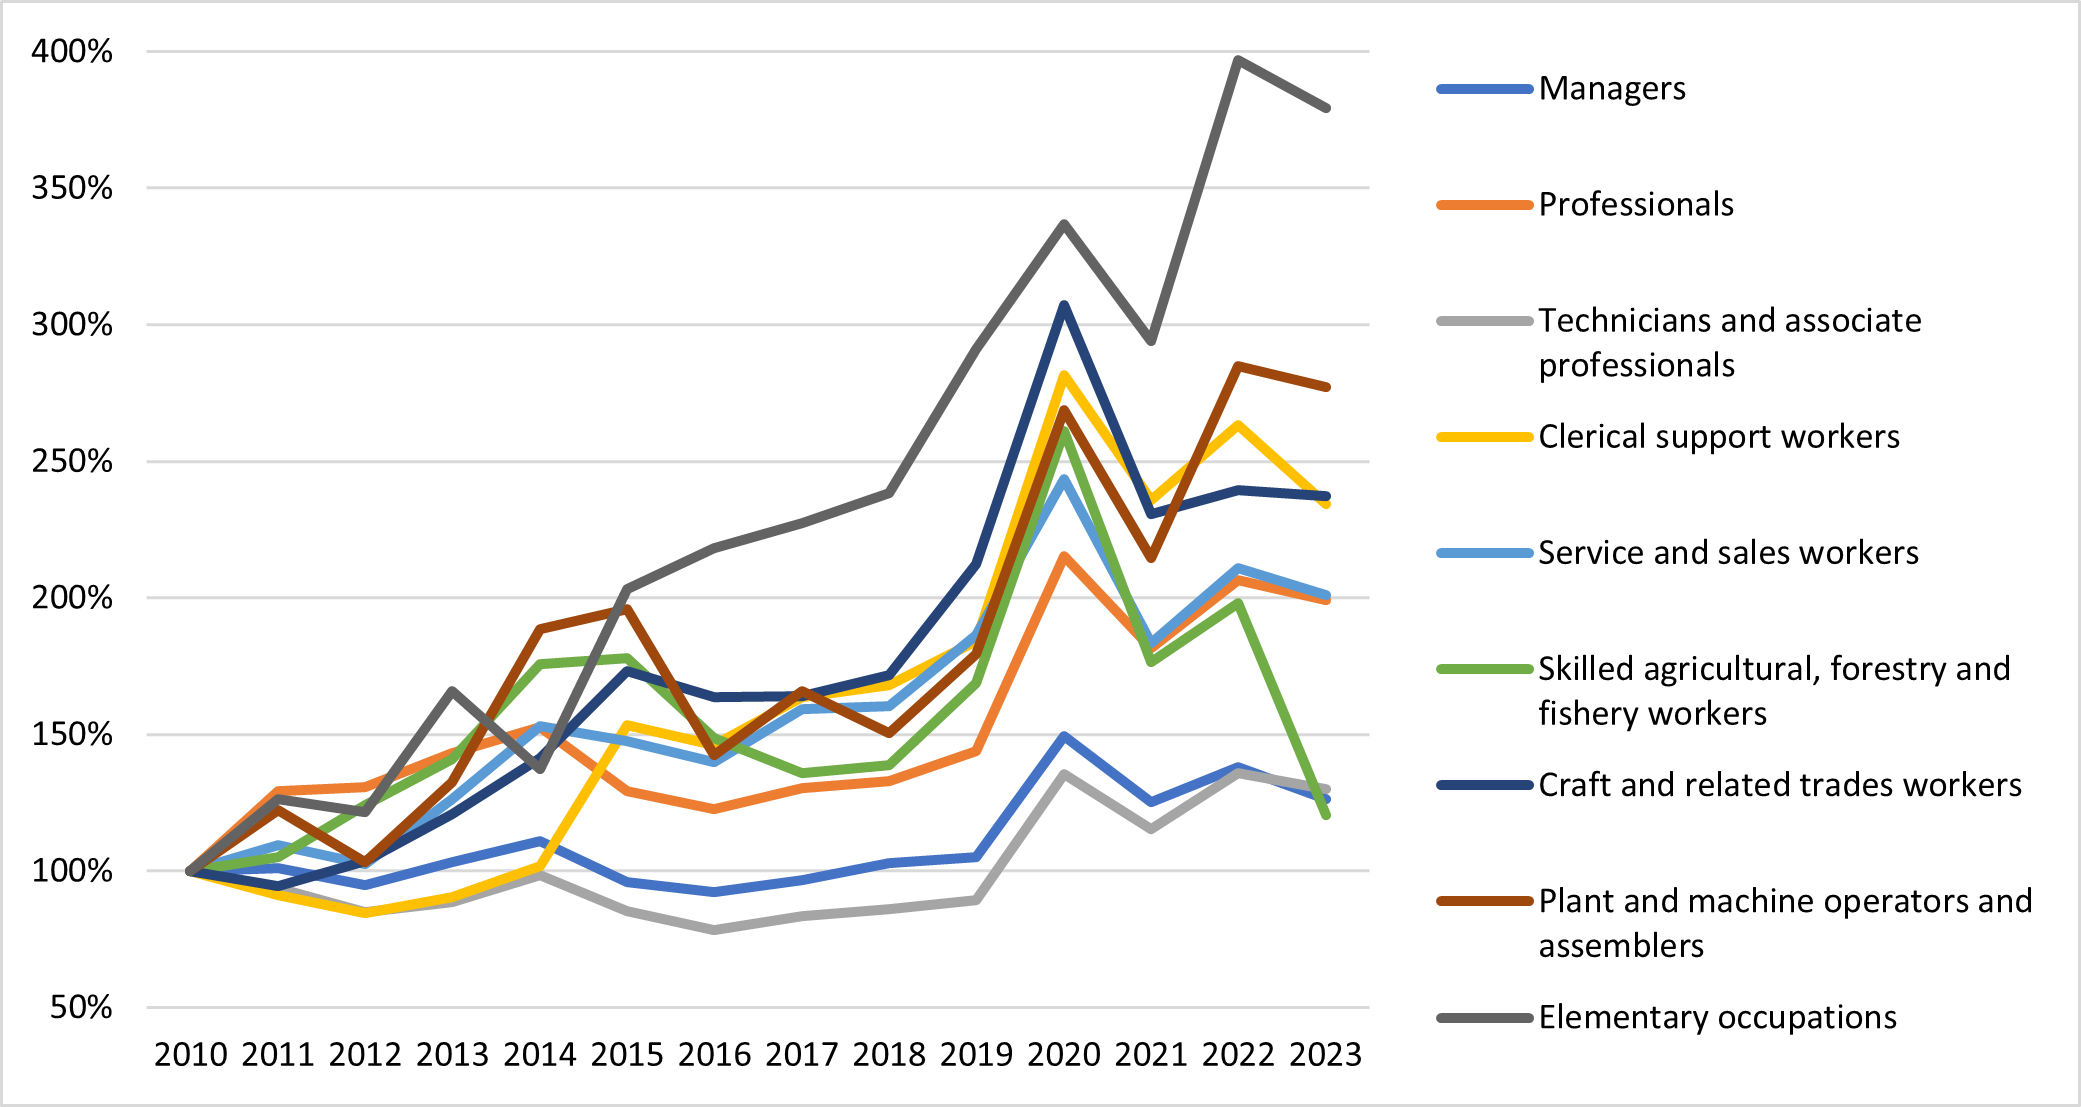
Figure 16. Labour demand (ILD3) – Lithuania, higher education.

Figure 17

Figure 17. Labour demand (ILD3) – Malta, higher education.

Figure 18

Figure 18. Labour demand (ILD3) – Netherlands, higher education.

Figure 19

Figure 19. Labour demand (ILD3) – Poland, higher education.

Figure 20

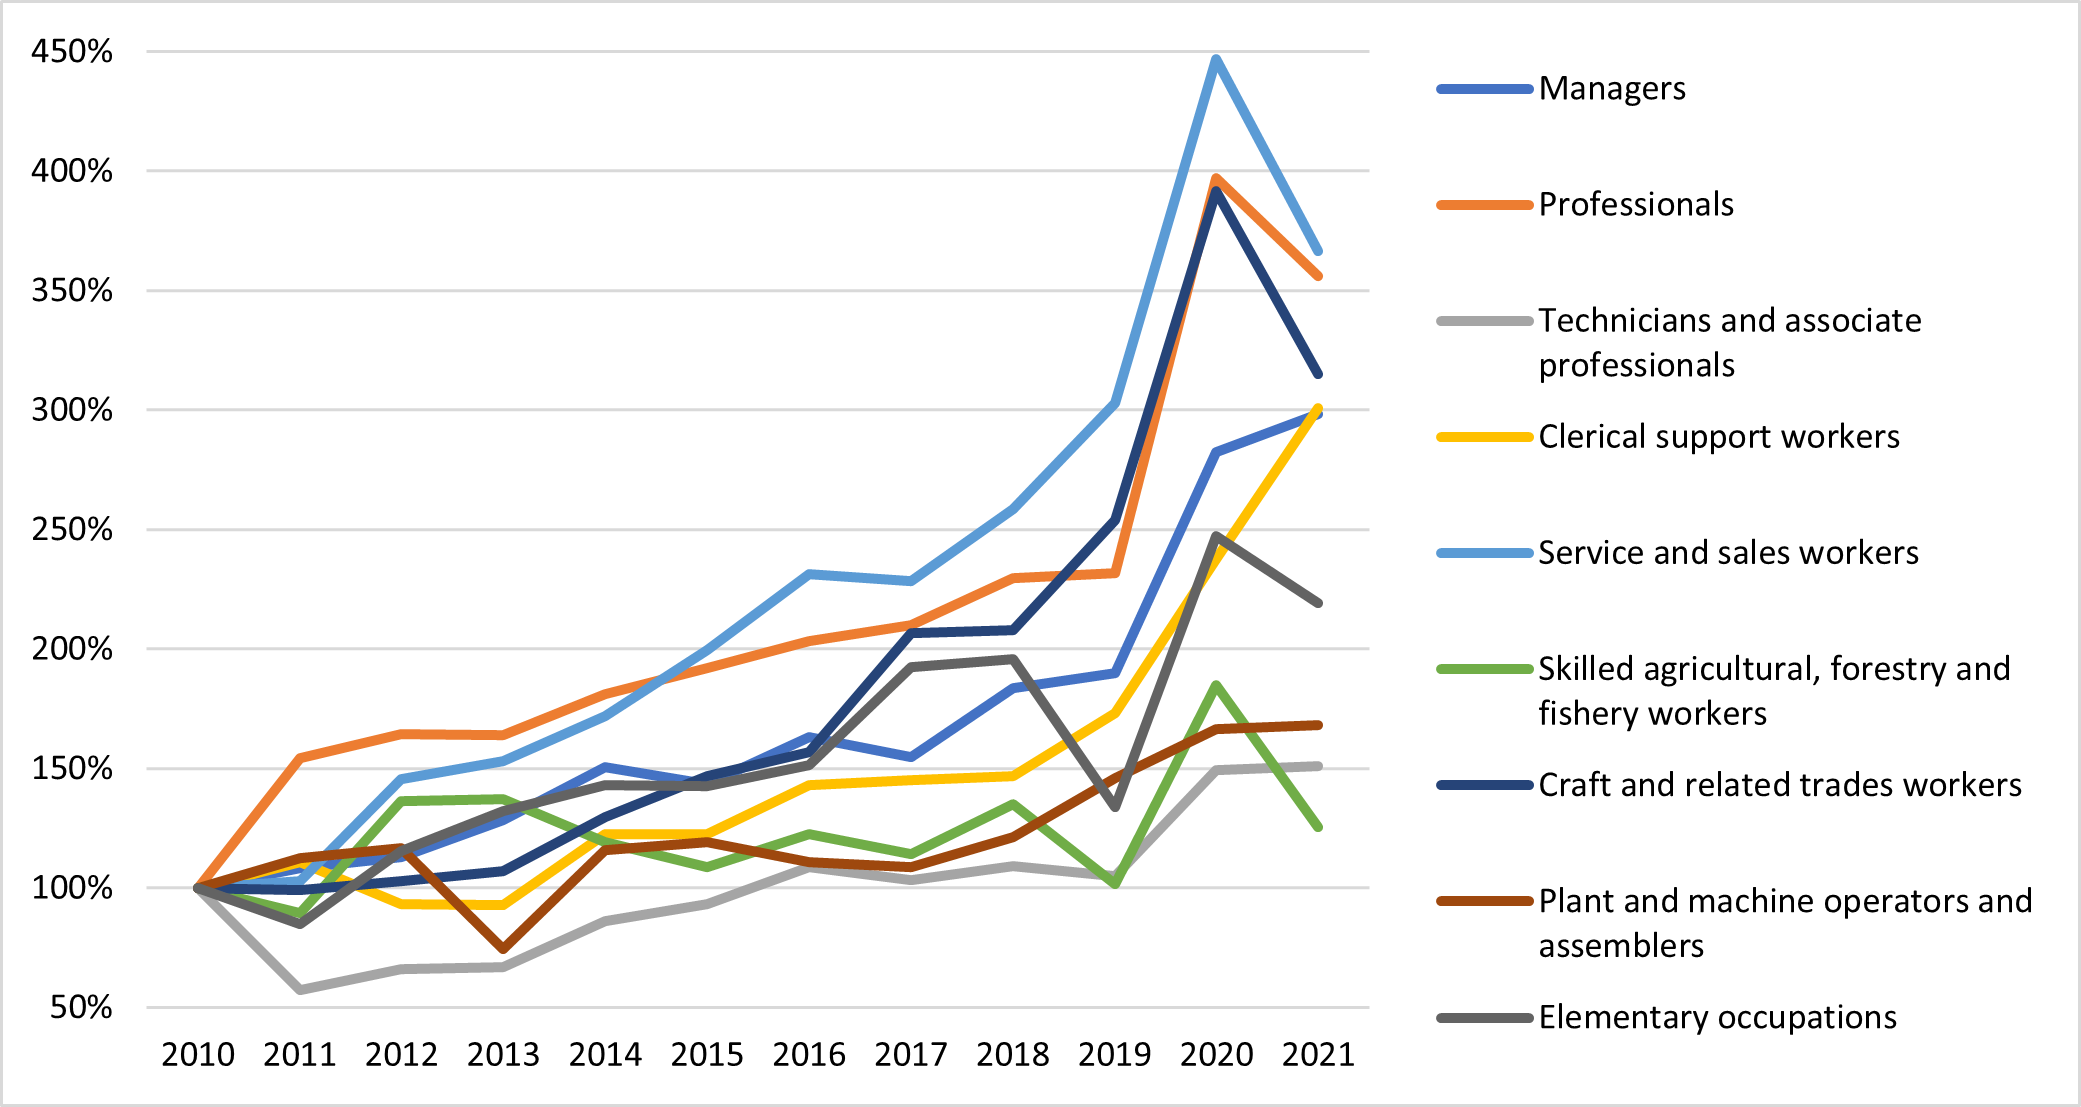
Figure 20. Labour demand (ILD3) – Portugal, higher education.

Figure 21

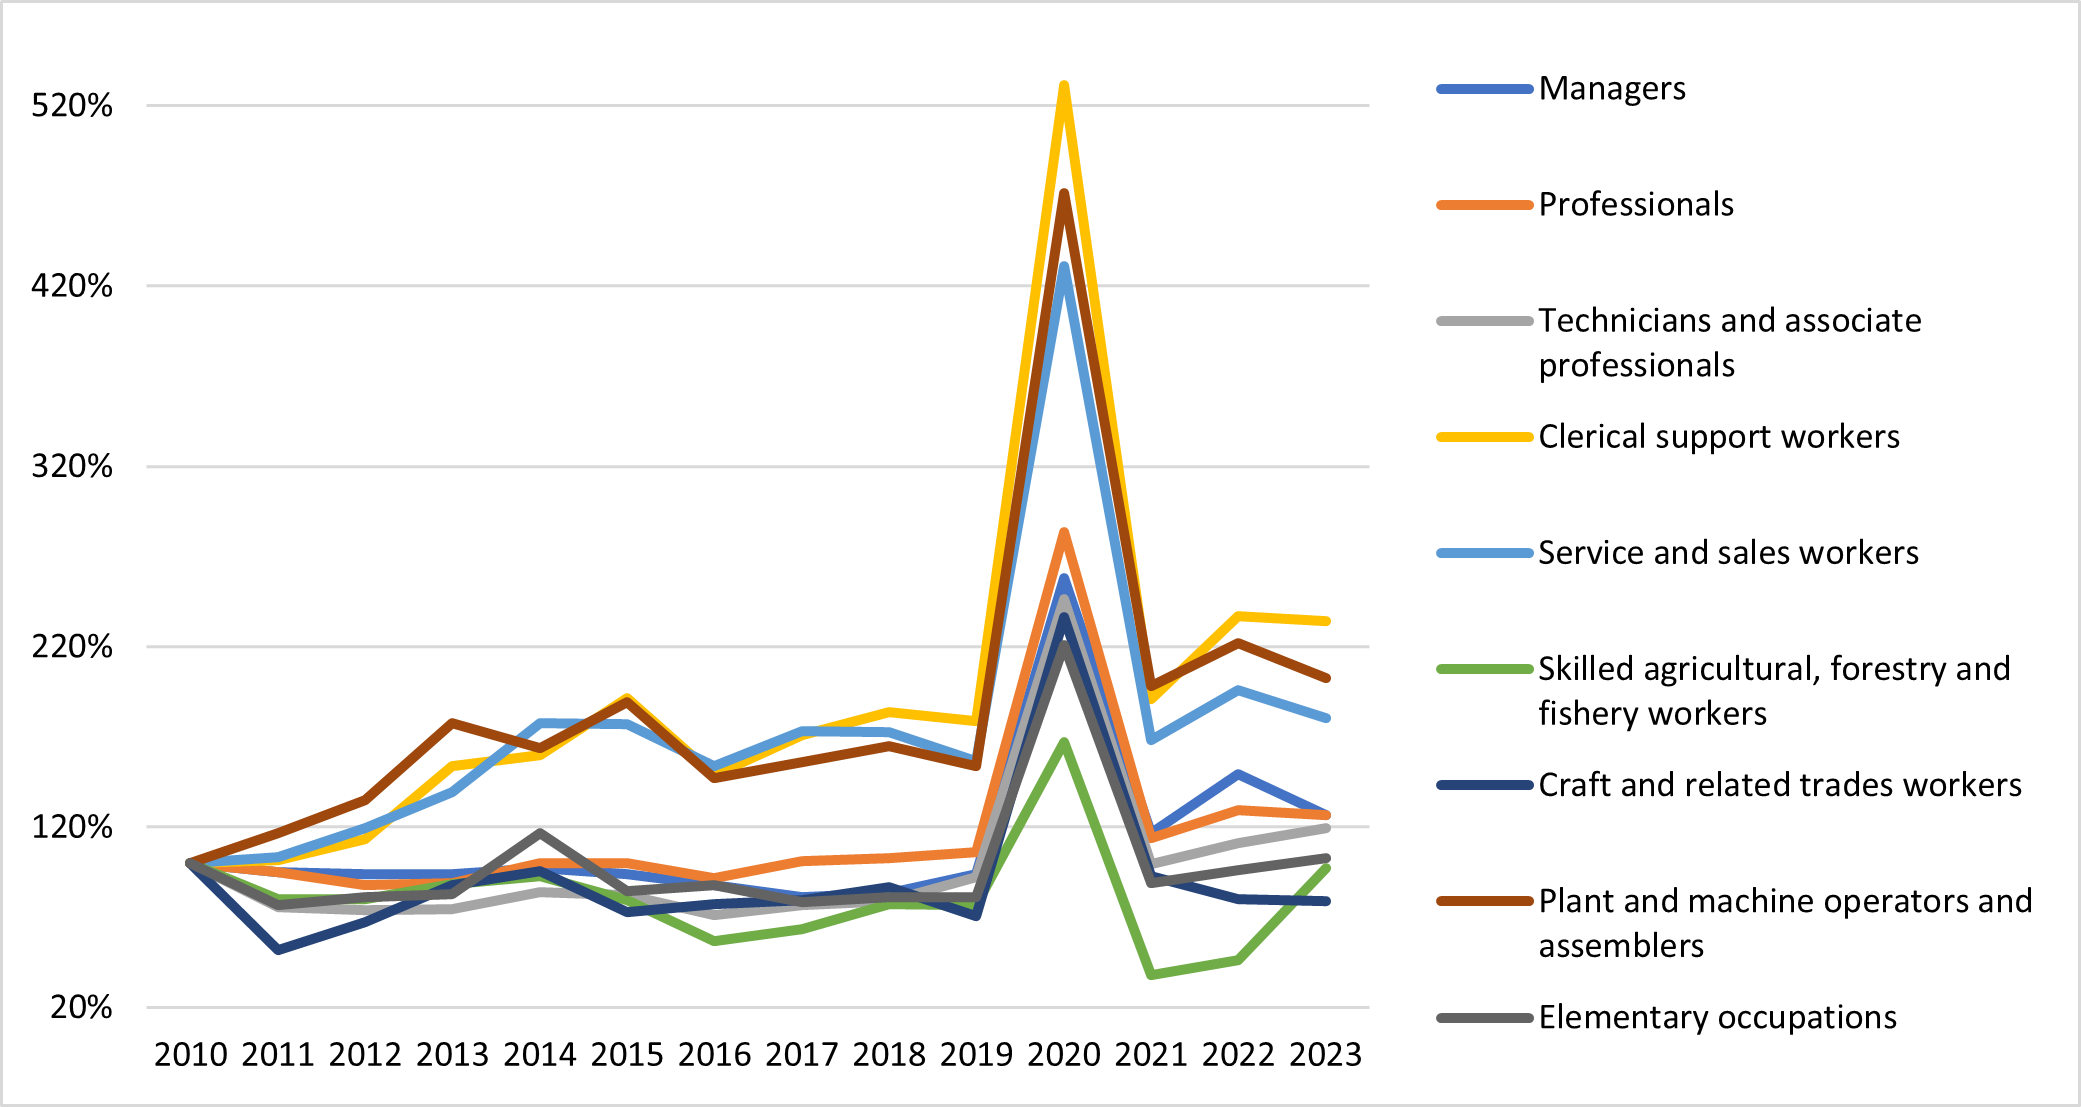
Figure 21. Labour demand (ILD3) – Romania, higher education.

Figure 22

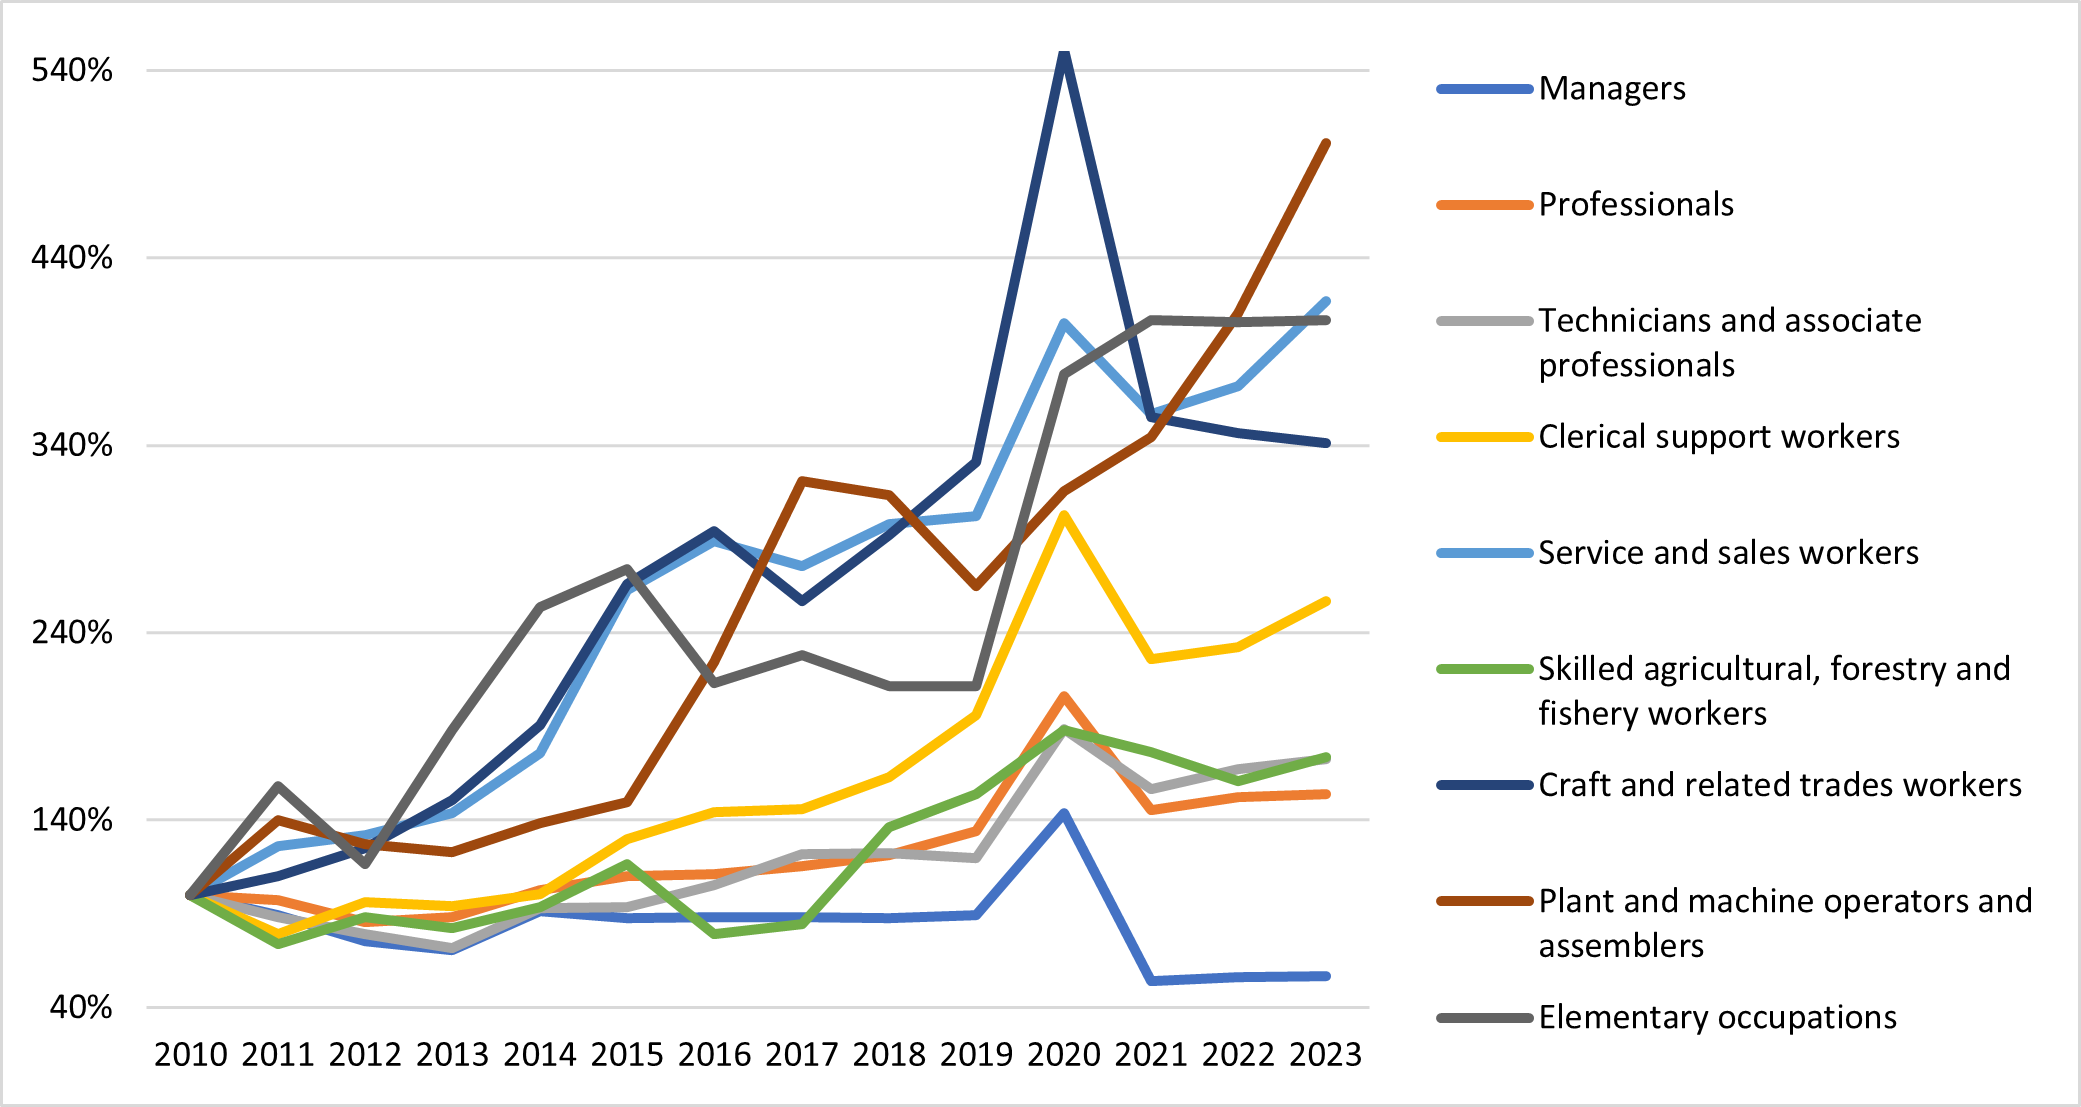
Figure 22. Labour demand (ILD3) – Slovenia, higher education.

Figure 23

Figure 23. Labour demand (ILD3) – Spain, higher education.

Figure 24

Figure 24. Labour demand (ILD3) – Sweden, higher education.

Labour demand visualisation – secondary education
Figure 1

Figure 1. Labour demand (ILD3) – Austria, secondary education.

Figure 2

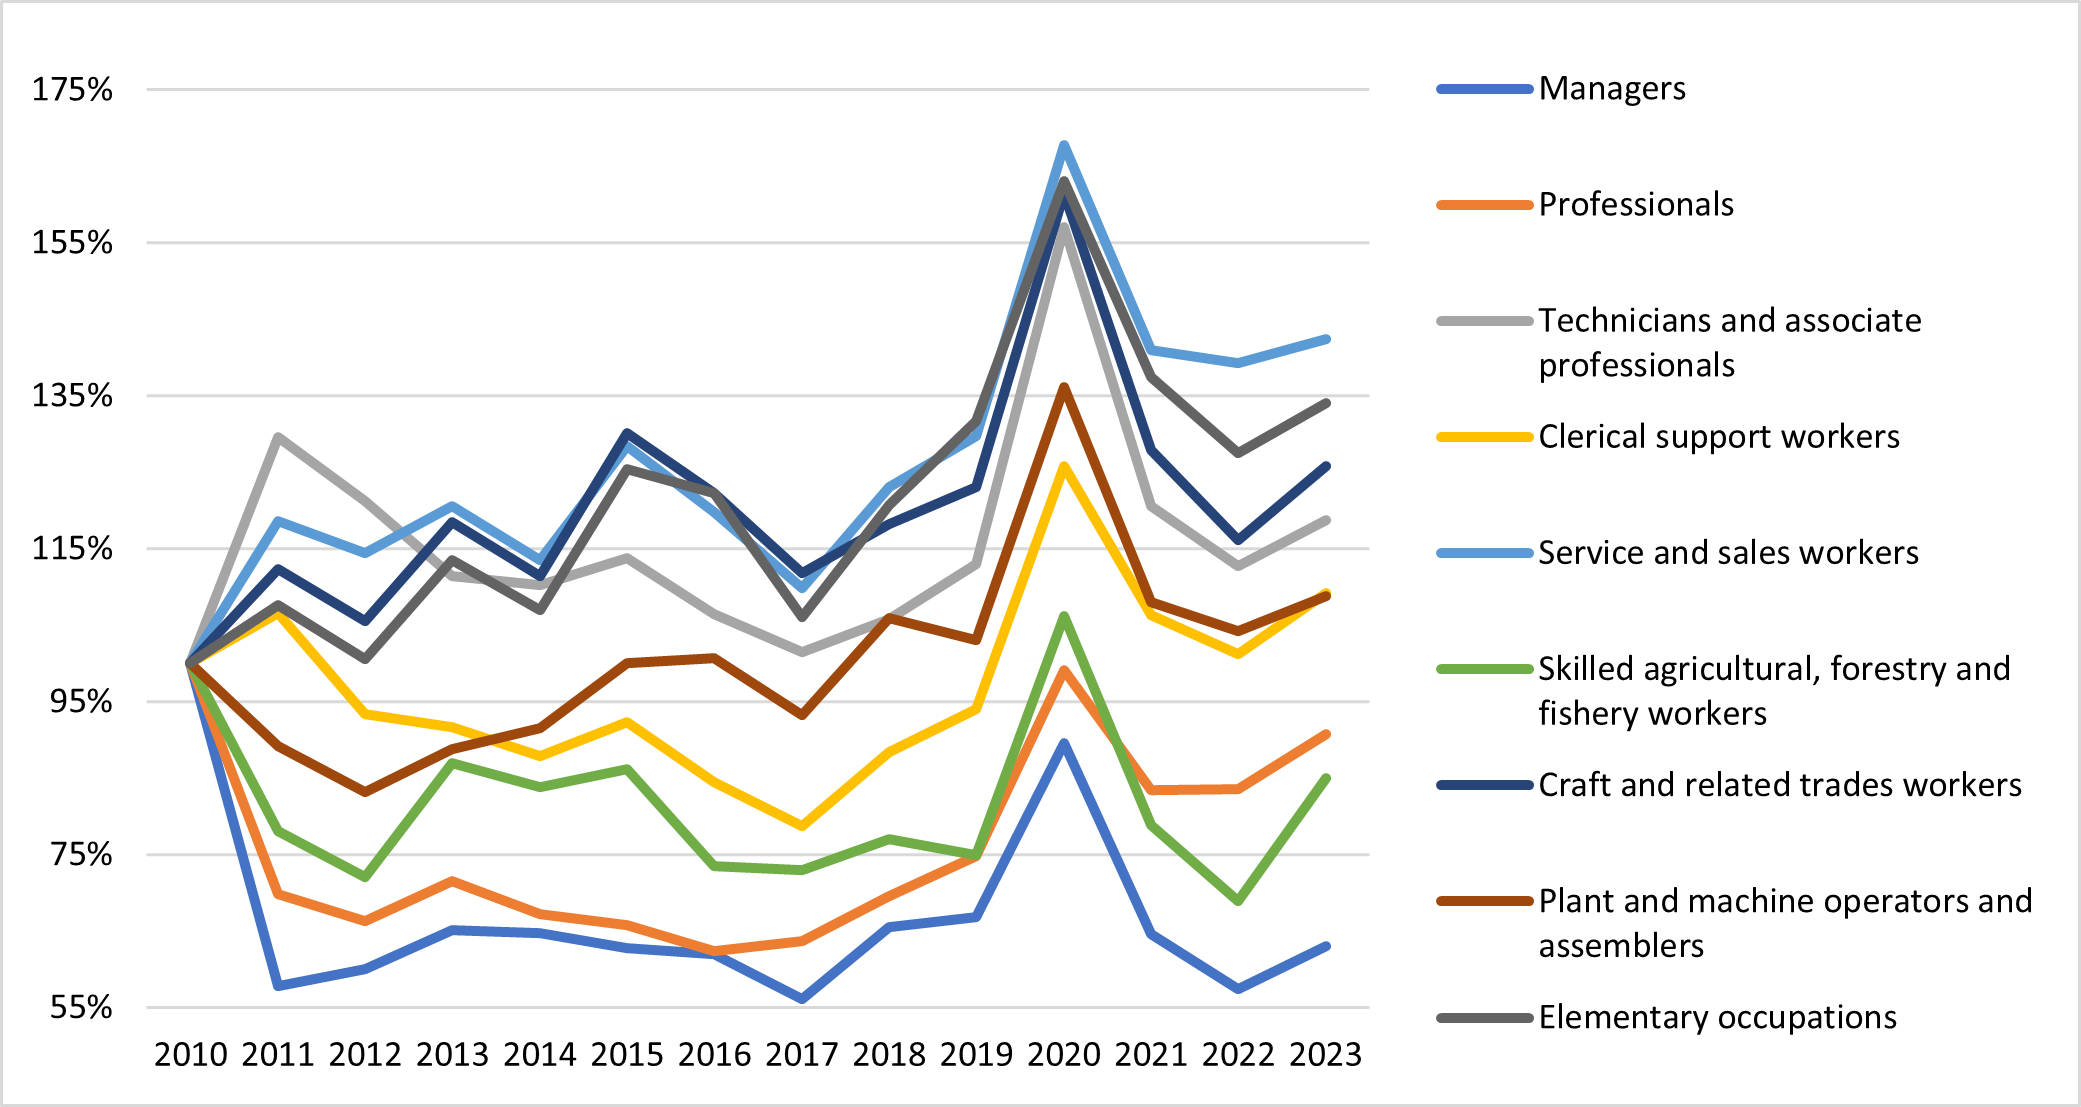
Figure 2. Labour demand (ILD3) – Belgium, secondary education.

Figure 3

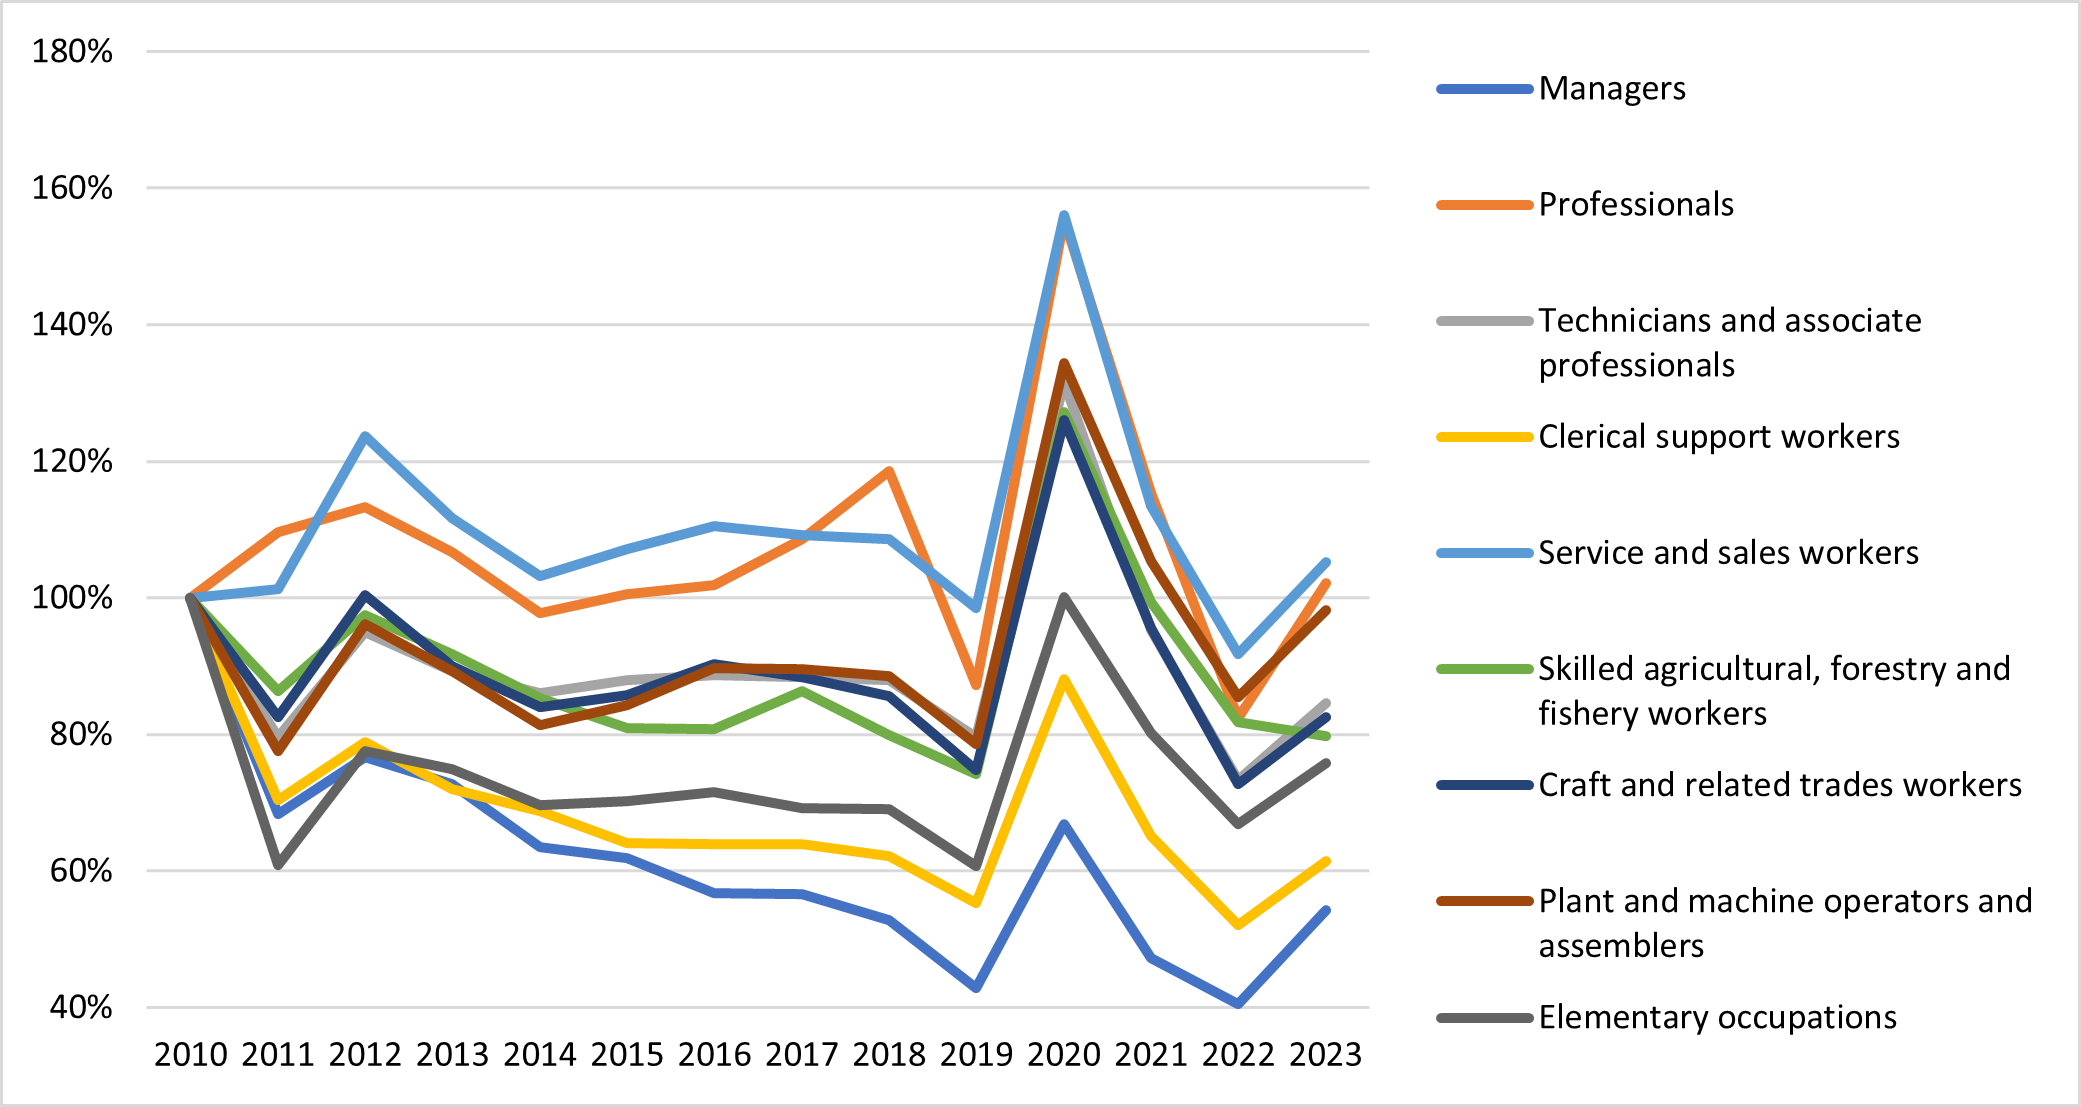
Figure 3. Labour demand (ILD3) – Bulgaria, secondary education.

Figure 4

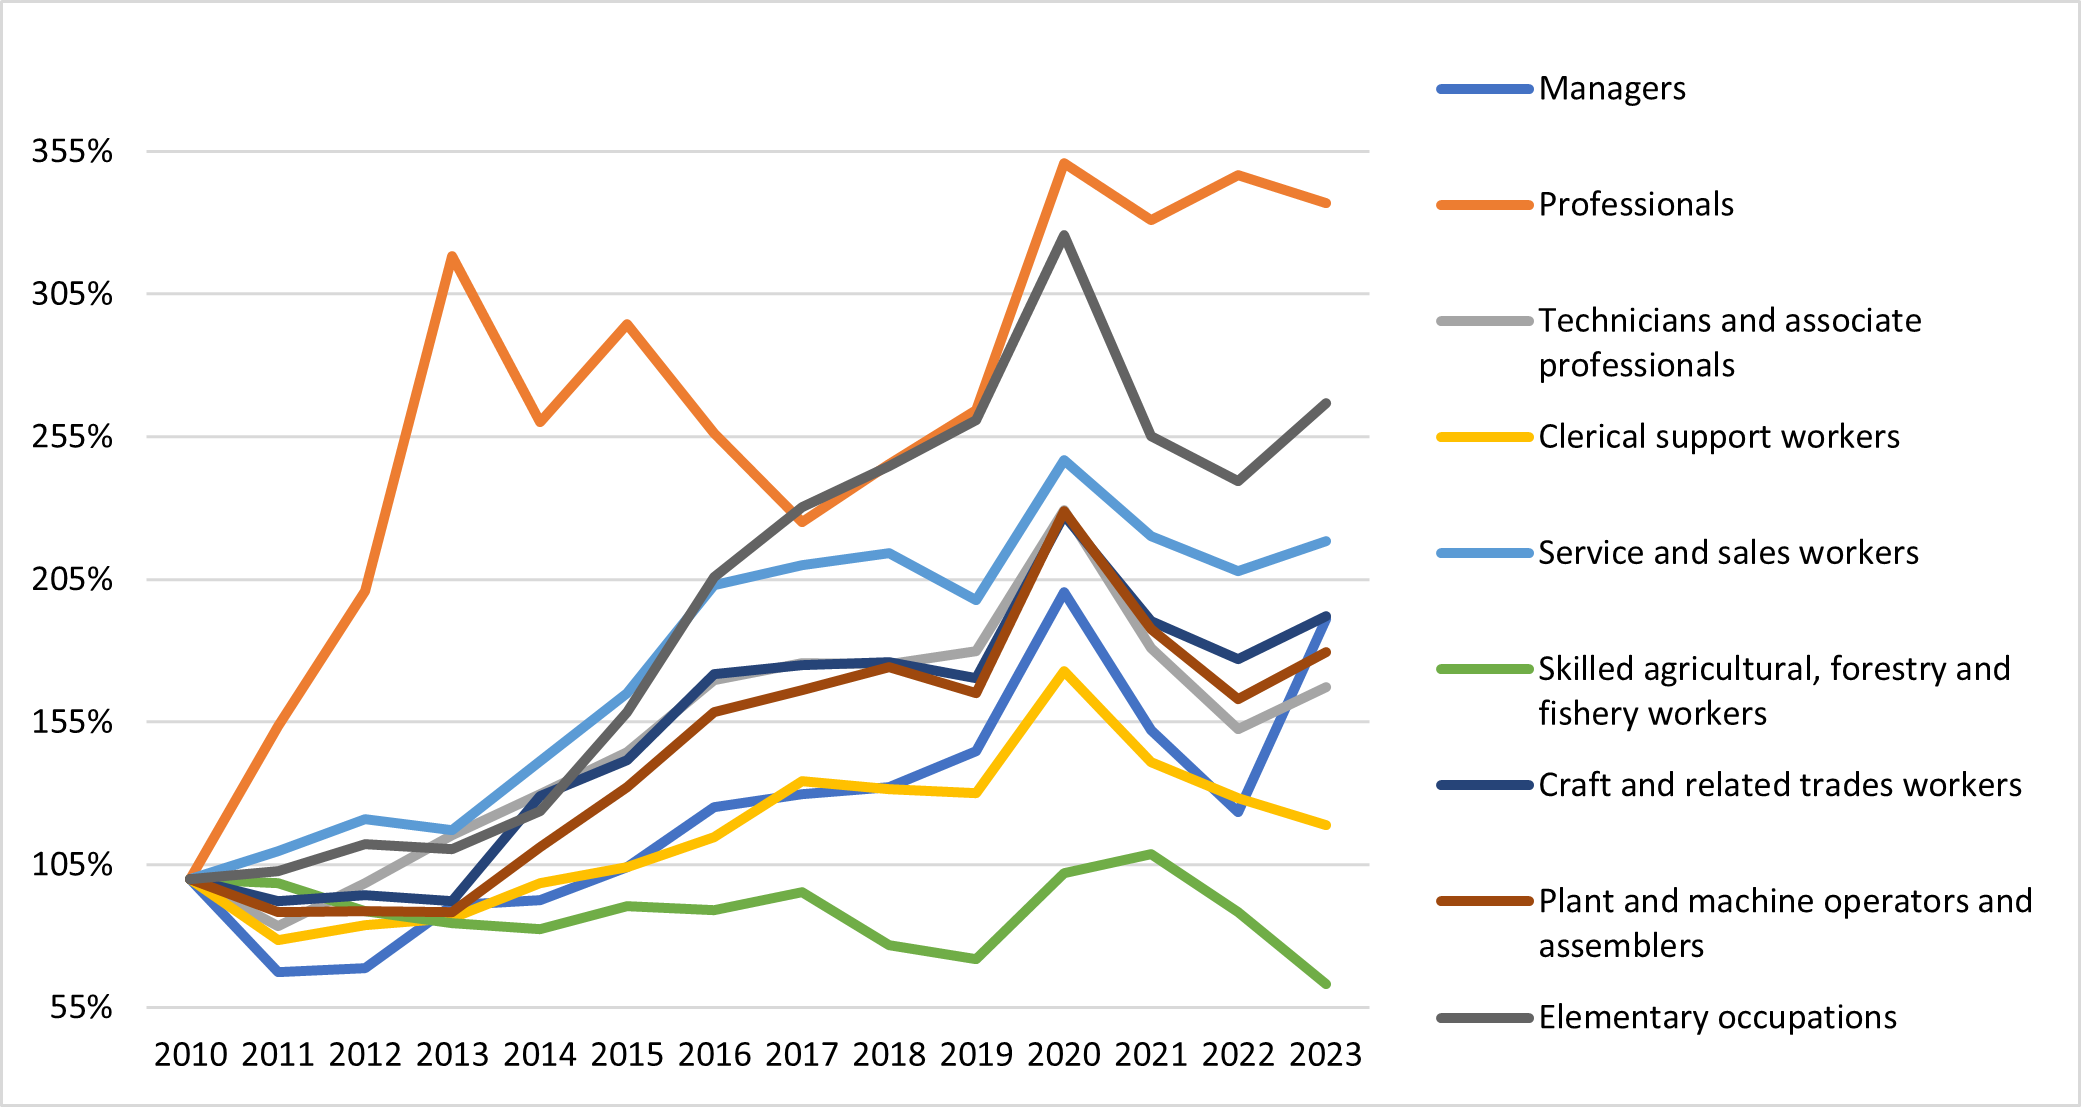
Figure 4. Labour demand (ILD3) – Croatia, secondary education.

Figure 5

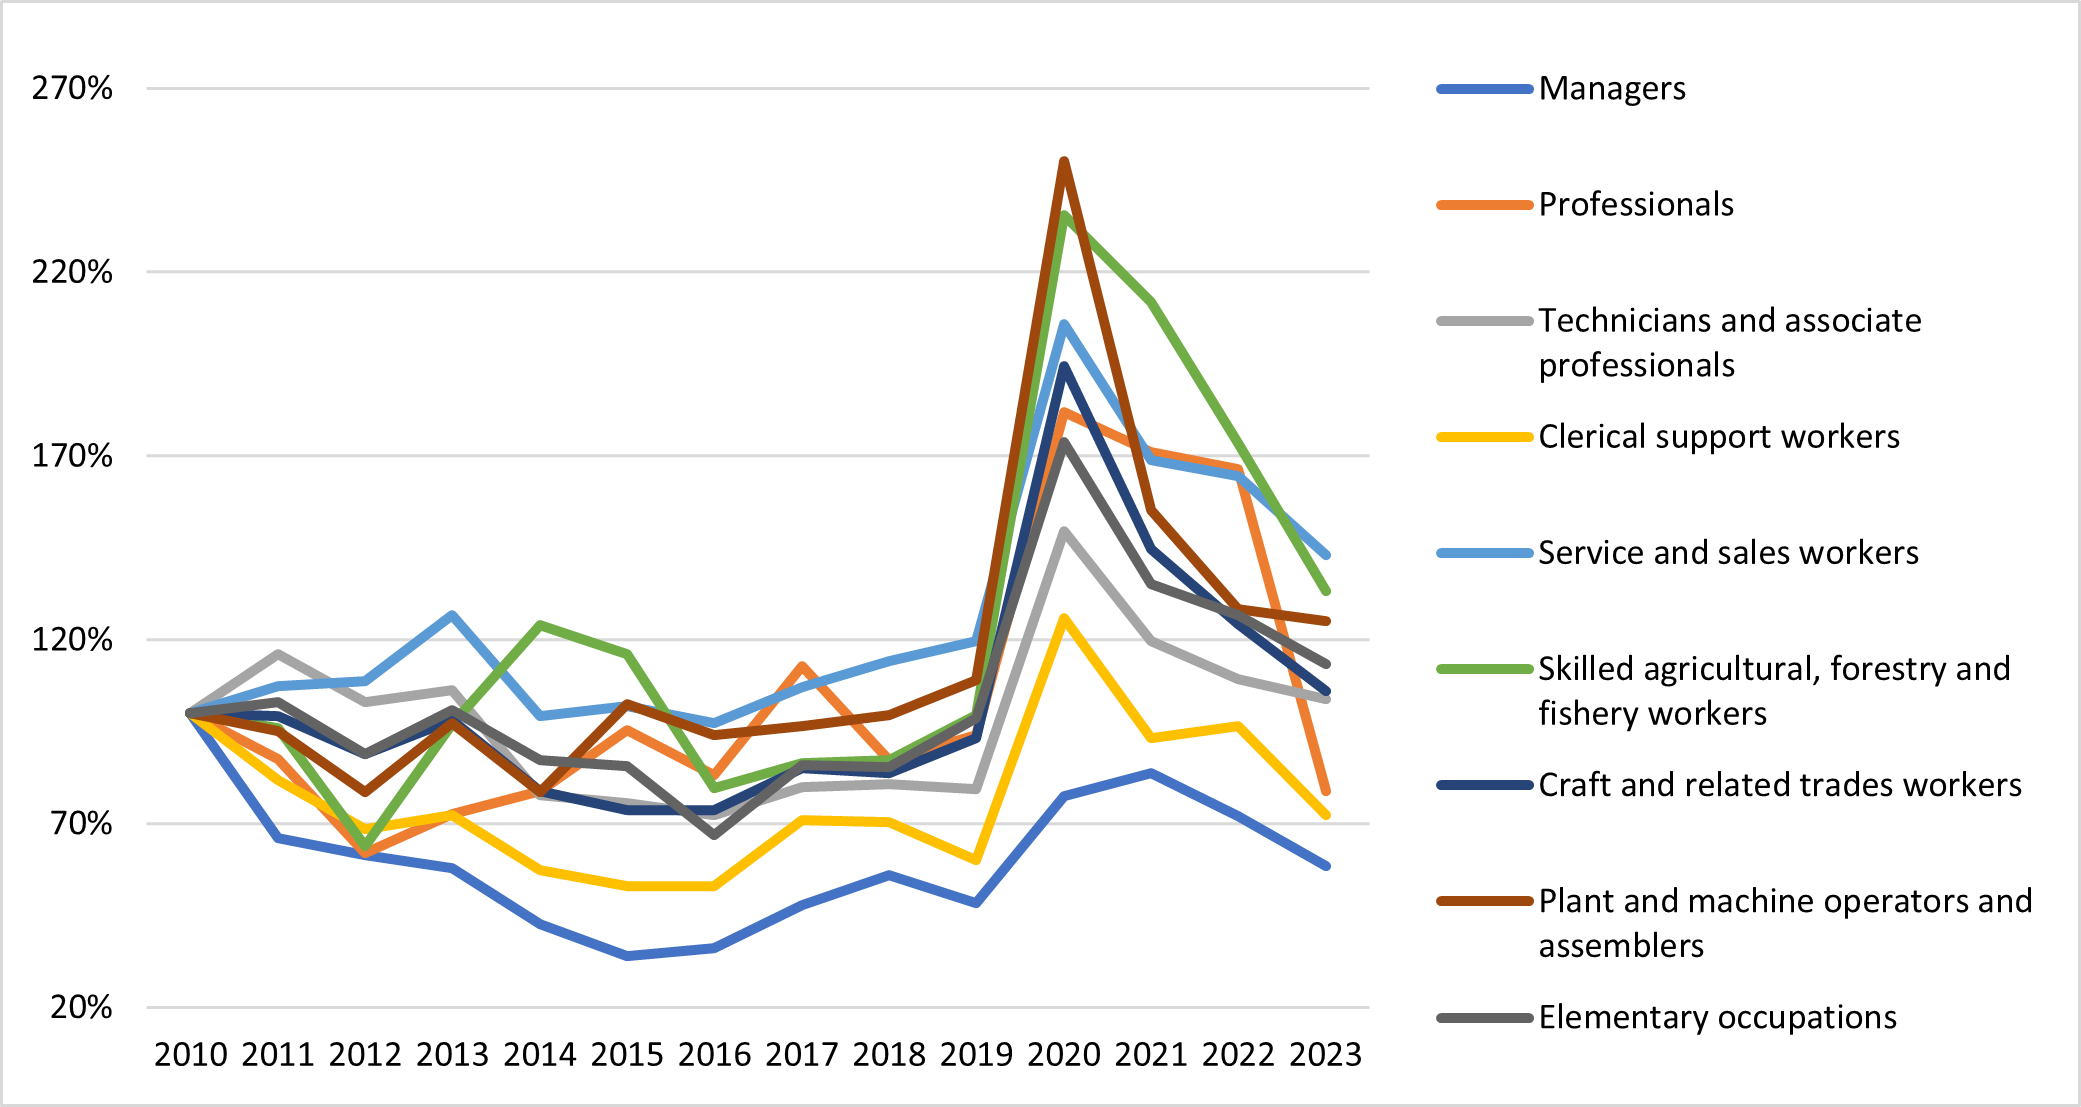
Figure 5. Labour demand (ILD3) – Cyprus, secondary education.

Figure 6

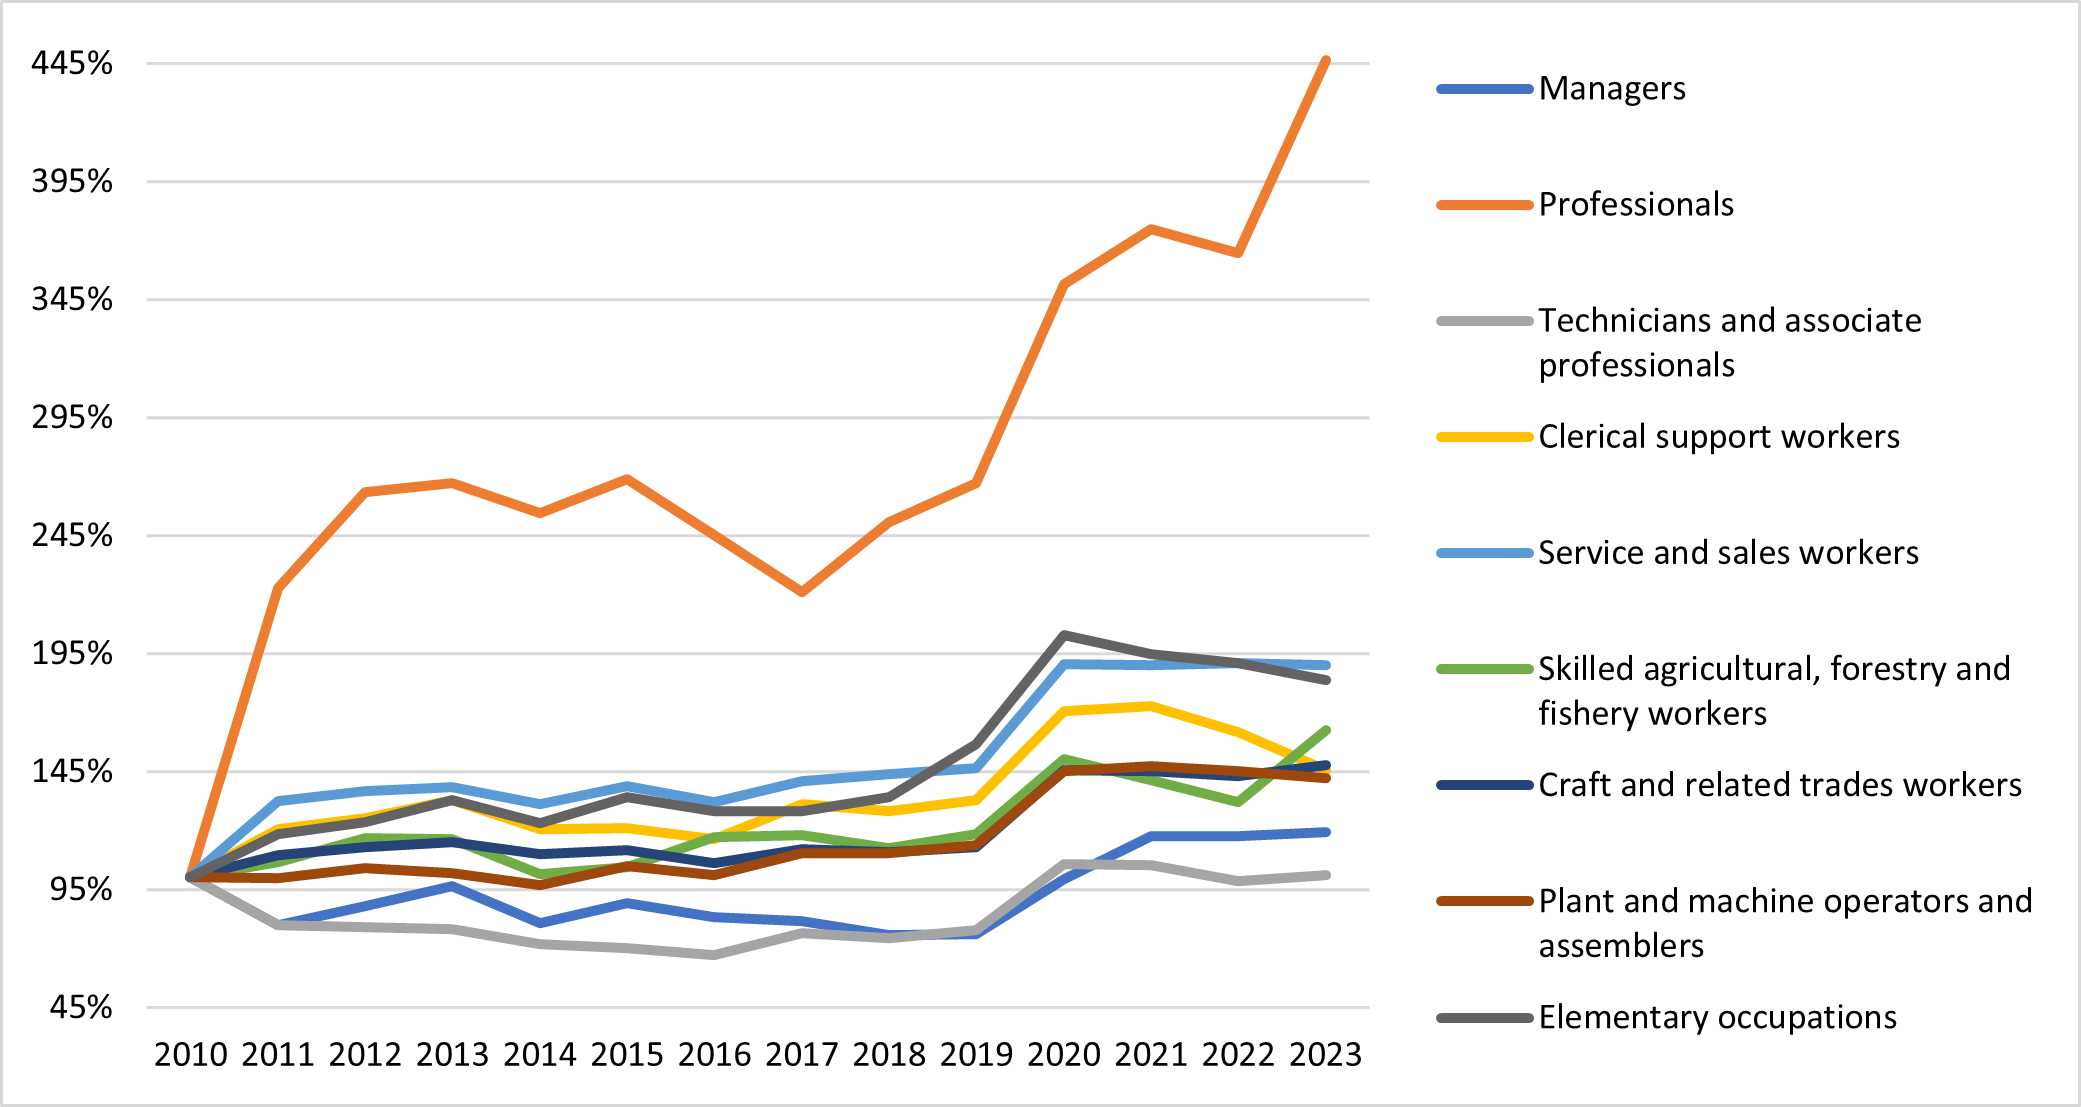
Figure 6. Labour demand (ILD3) – Czechia, secondary education.

Figure 7

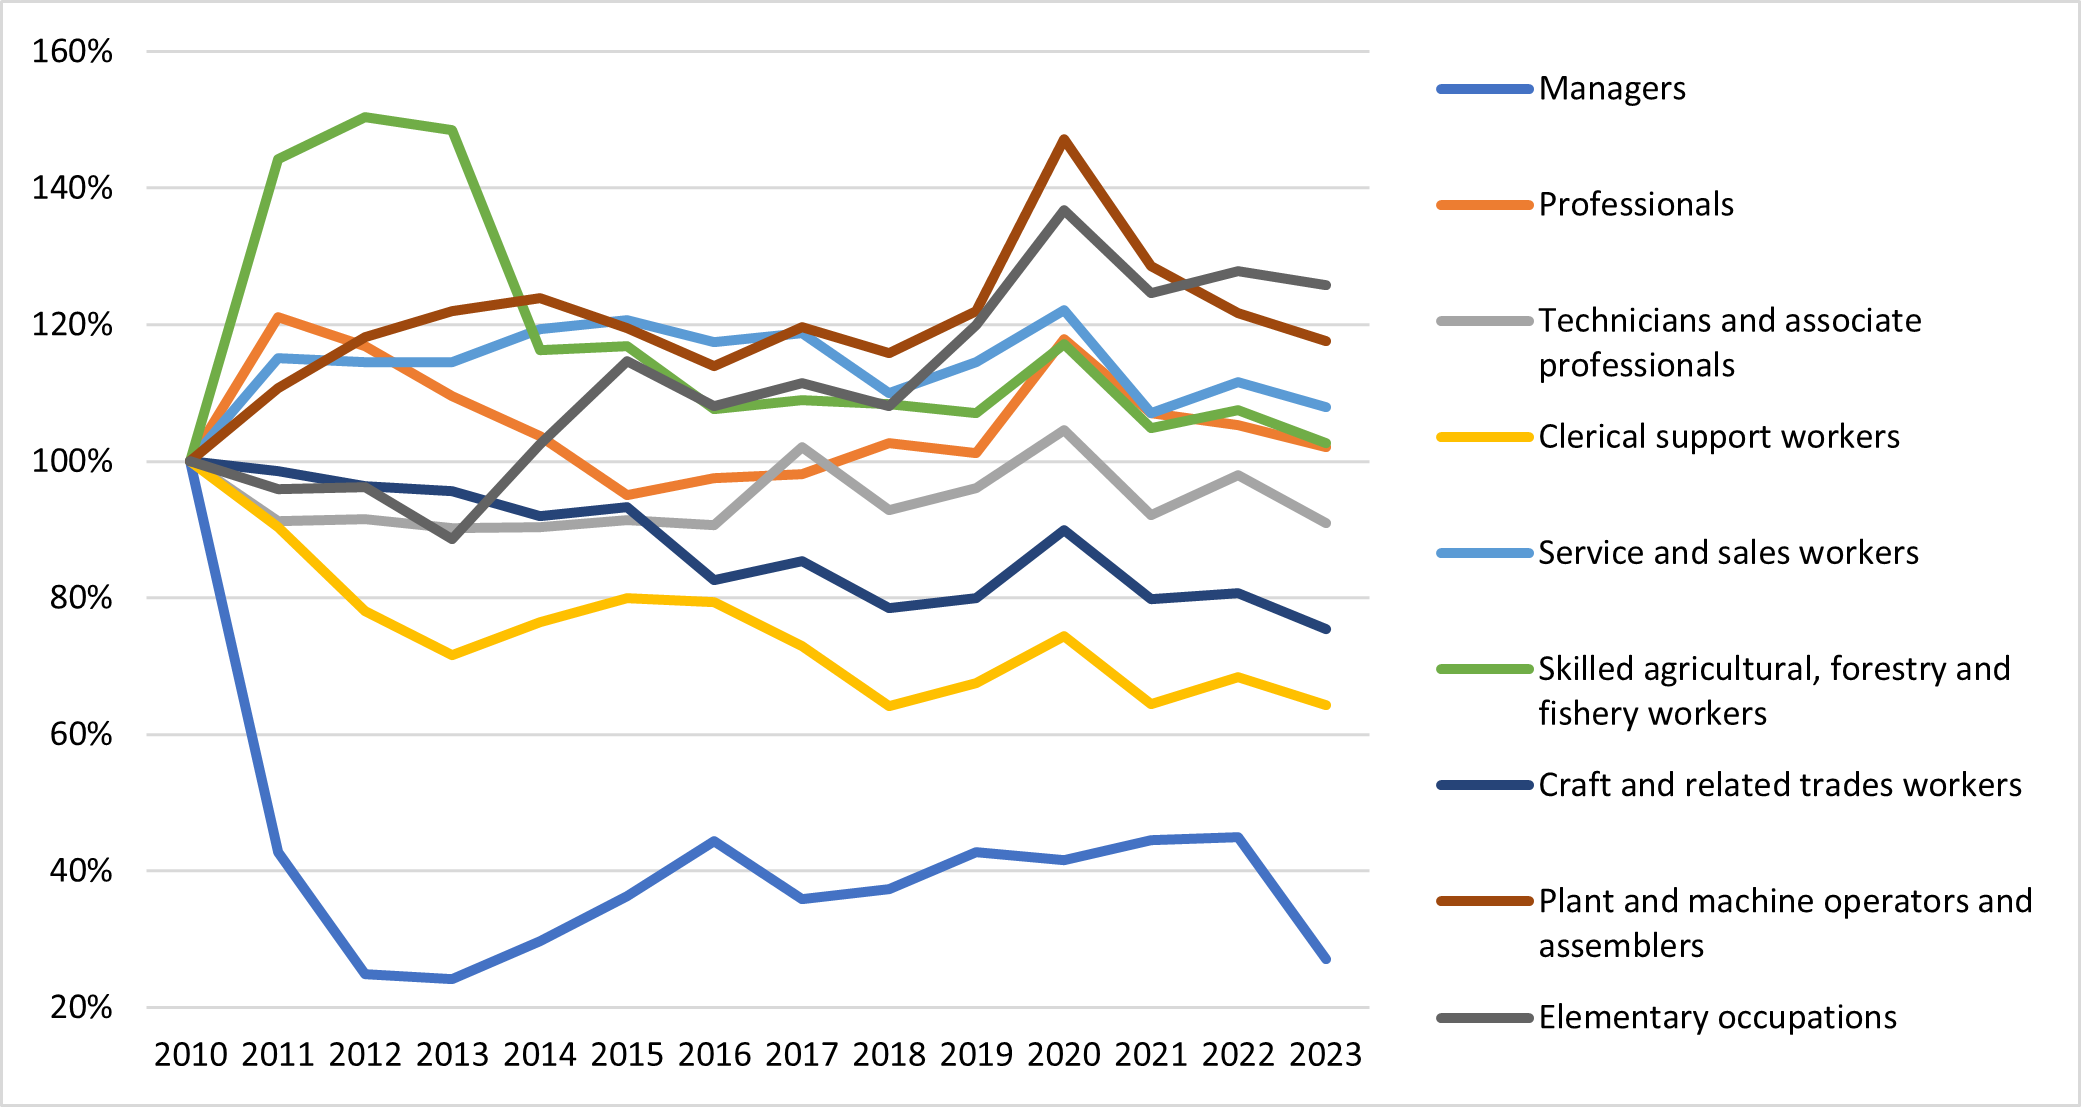
Figure 7. Labour demand (ILD3) – Denmark, secondary education.

Figure 8

Figure 8. Labour demand (ILD3) – Estonia, secondary education.

Figure 9

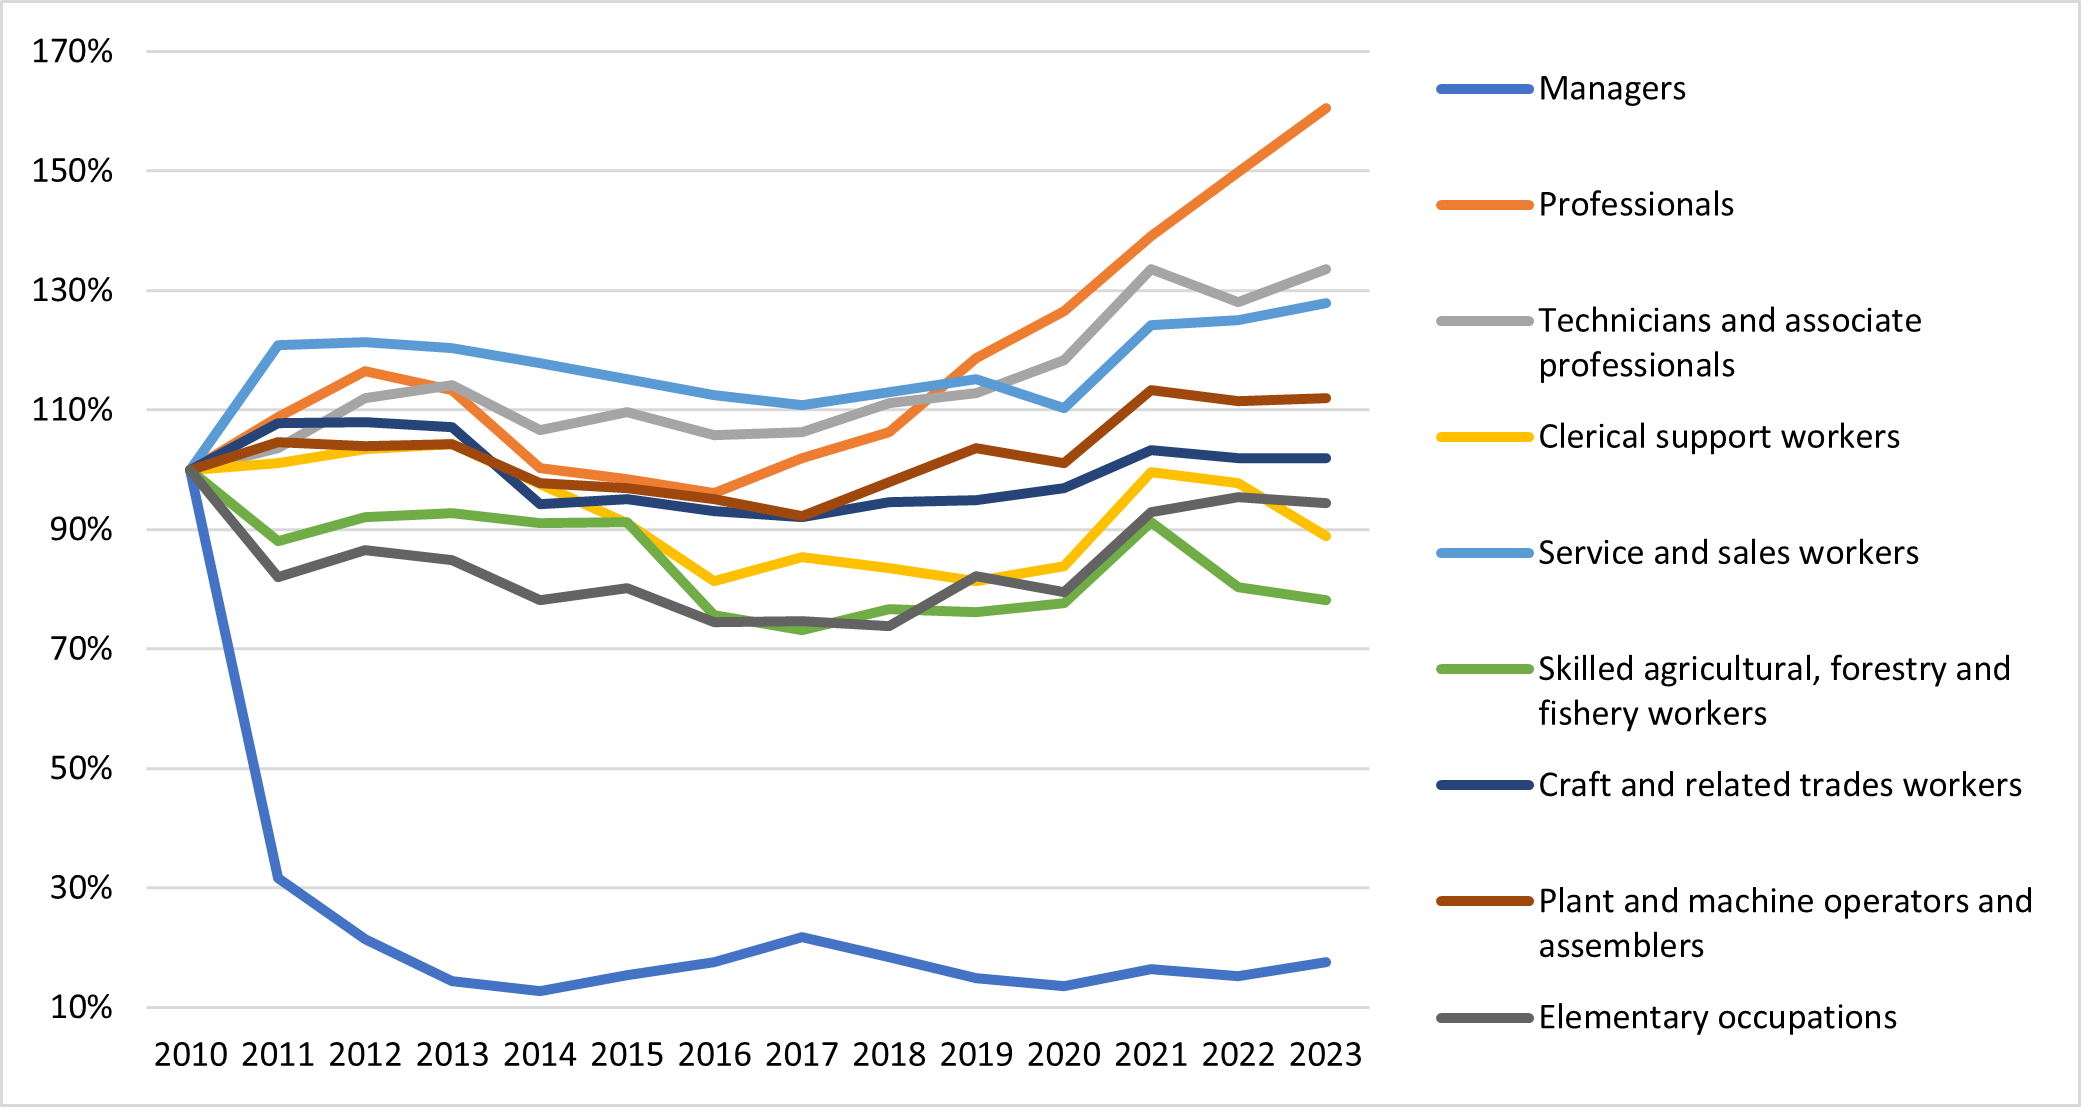
Figure 9. Labour demand (ILD3) – Finland, secondary education.

Figure 10

Figure 10. Labour demand (ILD3) – France, secondary education.

Figure 11

Figure 11. Labour demand (ILD3) – Germany, secondary education.

Figure 12

Figure 12. Labour demand (ILD3) – Hungary, secondary education.

Figure 13

Figure 13. Labour demand (ILD3) – Ireland, secondary education.

Figure 14

Figure 14. Labour demand (ILD3) – Italy, secondary education.

Figure 15

Figure 15. Labour demand (ILD3) – Latvia, secondary education.

Figure 16

Figure 16. Labour demand (ILD3) – Lithuania, secondary education.

Figure 17

Figure 17. Labour demand (ILD3) – Malta, secondary education.

Figure 18

Figure 18. Labour demand (ILD3) – Netherlands, secondary education.

Figure 19

Figure 19. Labour demand (ILD3) – Poland, secondary education.

Figure 20

Figure 20. Labour demand (ILD3) – Portugal, secondary education.

Figure 21

Figure 21. Labour demand (ILD3) – Romania, secondary education.

Figure 22

Figure 22. Labour demand (ILD3) – Slovenia, secondary education.

Figure 23

Figure 23. Labour demand (ILD3) – Spain, secondary education.

Figure 24

Figure 24. Labour demand (ILD3) – Sweden, secondary education.

The following tables present linear trends in labour demand intensity (ILD3) across major occupational groups (ISCO-08) in selected EU countries, classified by education level based on the ISCED framework. The data cover the period from 2010 to 2023. A plus sign (“+”) indicates a rising trend in labour demand within a given occupational group, a minus sign (“−”) represents a declining trend. This structure allows for a comparative overview of how qualification levels relate to labour demand dynamics across the European labour market.

ISCO-08 groups: 1 – Managers, 2 – Professionals, 3 – Technicians and associate professionals, 4 – Clerical support workers, 5 – Service and sales workers, 6 – Skilled agricultural, forestry and fishery workers, 7 – Craft and related trades workers, 8 – Plant and machine operators and assemblers, 9 – Elementary occupations.

Labour demand trends for higher education
Kraj
ISCO1
ISCO2
ISCO3
ISCO4
ISCO5
ISCO6
ISCO7
ISCO8
ISCO9
Austria
+
+
+
+
+
+
+
+
+
Belgium
+
+
+
+
+
+
+
+
+
Bulgaria
+
+
+
+
+
+
+
+
-
Croatia
+
+
+
+
+
+
+
+
+
Cyprus
+
+
+
+
+
+
+
+
+
Czechia
+
+
+
+
+
+
+
+
+
Denmark
+
+
-
+
+
-
+
+
+
Estonia
+
+
+
+
+
+
+
+
+
Finland
-
+
+
-
+
+
+
+
+
France
+
+
+
+
+
+
+
+
+
Germany
+
+
-
+
+
+
+
+
+
Hungary
+
+
+
+
+
+
+
+
+
Ireland
+
+
+
+
+
+
+
+
+
Italy
+
+
+
+
+
+
+
+
+
Latvia
+
+
+
+
+
+
+
+
+
Lithuania
+
+
+
+
+
+
+
+
+
Malta
+
+
+
+
+
+
+
+
+
Netherlands
-
+
+
+
+
+
+
+
+
Poland
+
+
+
+
+
+
+
+
+
Portugal
+
+
+
+
+
+
+
+
+
Romania
+
+
+
+
+
-
+
+
+
Slovenia
-
+
+
+
+
+
+
+
+
Spain
+
+
+
+
+
+
+
+
+
Sweden
+
+
+
+
+
+
+
+
+

ISCO1 +
ISCO2 +
ISCO3 +
ISCO4 +
ISCO5 +
ISCO6 +
ISCO7 +
ISCO8 +
ISCO9 +

ISCO1 +
ISCO2 +
ISCO3 +
ISCO4 +
ISCO5 +
ISCO6 +
ISCO7 +
ISCO8 +
ISCO9 +

ISCO1 +
ISCO2 +
ISCO3 +
ISCO4 +
ISCO5 +
ISCO6 +
ISCO7 +
ISCO8 +
ISCO9

ISCO1 +
ISCO2 +
ISCO3 +
ISCO4 +
ISCO5 +
ISCO6 +
ISCO7 +
ISCO8 +
ISCO9 +

ISCO1 +
ISCO2 +
ISCO3 +
ISCO4 +
ISCO5 +
ISCO6 +
ISCO7 +
ISCO8 +
ISCO9 +

ISCO1 +
ISCO2 +
ISCO3 +
ISCO4 +
ISCO5 +
ISCO6 +
ISCO7 +
ISCO8 +
ISCO9 +

ISCO1 +
ISCO2 +
ISCO3
ISCO4 +
ISCO5 +
ISCO6
ISCO7 +
ISCO8 +
ISCO9 +

ISCO1 +
ISCO2 +
ISCO3 +
ISCO4 +
ISCO5 +
ISCO6 +
ISCO7 +
ISCO8 +
ISCO9 +

ISCO1
ISCO2 +
ISCO3 +
ISCO4
ISCO5 +
ISCO6 +
ISCO7 +
ISCO8 +
ISCO9 +

ISCO1 +
ISCO2 +
ISCO3 +
ISCO4 +
ISCO5 +
ISCO6 +
ISCO7 +
ISCO8 +
ISCO9 +

ISCO1 +
ISCO2 +
ISCO3
ISCO4 +
ISCO5 +
ISCO6 +
ISCO7 +
ISCO8 +
ISCO9 +

ISCO1 +
ISCO2 +
ISCO3 +
ISCO4 +
ISCO5 +
ISCO6 +
ISCO7 +
ISCO8 +
ISCO9 +

ISCO1 +
ISCO2 +
ISCO3 +
ISCO4 +
ISCO5 +
ISCO6 +
ISCO7 +
ISCO8 +
ISCO9 +

ISCO1 +
ISCO2 +
ISCO3 +
ISCO4 +
ISCO5 +
ISCO6 +
ISCO7 +
ISCO8 +
ISCO9 +

ISCO1 +
ISCO2 +
ISCO3 +
ISCO4 +
ISCO5 +
ISCO6 +
ISCO7 +
ISCO8 +
ISCO9 +

ISCO1 +
ISCO2 +
ISCO3 +
ISCO4 +
ISCO5 +
ISCO6 +
ISCO7 +
ISCO8 +
ISCO9 +

ISCO1 +
ISCO2 +
ISCO3 +
ISCO4 +
ISCO5 +
ISCO6 +
ISCO7 +
ISCO8 +
ISCO9 +

ISCO1
ISCO2 +
ISCO3 +
ISCO4 +
ISCO5 +
ISCO6 +
ISCO7 +
ISCO8 +
ISCO9 +

ISCO1 +
ISCO2 +
ISCO3 +
ISCO4 +
ISCO5 +
ISCO6 +
ISCO7 +
ISCO8 +
ISCO9 +

ISCO1 +
ISCO2 +
ISCO3 +
ISCO4 +
ISCO5 +
ISCO6 +
ISCO7 +
ISCO8 +
ISCO9 +

ISCO1 +
ISCO2 +
ISCO3 +
ISCO4 +
ISCO5 +
ISCO6
ISCO7 +
ISCO8 +
ISCO9 +

ISCO1
ISCO2 +
ISCO3 +
ISCO4 +
ISCO5 +
ISCO6 +
ISCO7 +
ISCO8 +
ISCO9 +

ISCO1 +
ISCO2 +
ISCO3 +
ISCO4 +
ISCO5 +
ISCO6 +
ISCO7 +
ISCO8 +
ISCO9 +

ISCO1 +
ISCO2 +
ISCO3 +
ISCO4 +
ISCO5 +
ISCO6 +
ISCO7 +
ISCO8 +
ISCO9 +
Labour demand trends for secondary education
Kraj
ISCO1
ISCO2
ISCO3
ISCO4
ISCO5
ISCO6
ISCO7
ISCO8
ISCO9
Austria
-
+
-
-
+
-
-
+
-
Belgium
-
+
+
+
+
-
+
+
+
Bulgaria
-
+
-
-
+
-
-
+
-
Croatia
+
+
+
+
+
-
+
+
+
Cyprus
-
+
+
+
+
+
+
+
+
Czechia
+
+
+
+
+
+
+
+
+
Denmark
-
-
+
-
-
-
-
+
+
Estonia
+
+
+
+
+
+
+
+
+
Finland
-
+
+
-
+
-
-
+
+
France
-
+
-
-
+
+
+
+
+
Germany
-
+
+
-
-
-
-
-
-
Hungary
+
+
+
+
+
+
+
+
+
Ireland
+
+
+
+
+
+
+
+
+
Italy
-
+
-
-
+
+
+
+
+
Latvia
+
+
+
+
+
+
+
+
+
Lithuania
+
+
-
-
+
-
+
+
+
Malta
+
+
+
+
+
+
+
+
+
Netherlands
-
+
+
+
+
-
-
+
+
Poland
+
+
+
+
+
-
+
+
-
Portugal
+
+
+
+
+
+
+
+
+
Romania
+
+
-
+
+
-
+
+
+
Slovenia
-
+
-
-
+
-
+
+
+
Spain
-
+
+
+
+
+
+
+
+
Sweden
+
+
+
-
-
-
-
-
-

ISCO1
ISCO2 +
ISCO3
ISCO4
ISCO5 +
ISCO6
ISCO7
ISCO8 +
ISCO9

ISCO1
ISCO2 +
ISCO3 +
ISCO4 +
ISCO5 +
ISCO6
ISCO7 +
ISCO8 +
ISCO9 +

ISCO1
ISCO2 +
ISCO3
ISCO4
ISCO5 +
ISCO6
ISCO7
ISCO8 +
ISCO9

ISCO1 +
ISCO2 +
ISCO3 +
ISCO4 +
ISCO5 +
ISCO6
ISCO7 +
ISCO8 +
ISCO9 +

ISCO1
ISCO2 +
ISCO3 +
ISCO4 +
ISCO5 +
ISCO6 +
ISCO7 +
ISCO8 +
ISCO9 +

ISCO1 +
ISCO2 +
ISCO3 +
ISCO4 +
ISCO5 +
ISCO6 +
ISCO7 +
ISCO8 +
ISCO9 +

ISCO1
ISCO2
ISCO3 +
ISCO4
ISCO5
ISCO6
ISCO7
ISCO8 +
ISCO9 +

ISCO1 +
ISCO2 +
ISCO3 +
ISCO4 +
ISCO5 +
ISCO6 +
ISCO7 +
ISCO8 +
ISCO9 +

ISCO1
ISCO2 +
ISCO3 +
ISCO4
ISCO5 +
ISCO6
ISCO7
ISCO8 +
ISCO9 +

ISCO1
ISCO2 +
ISCO3
ISCO4
ISCO5 +
ISCO6 +
ISCO7 +
ISCO8 +
ISCO9 +

ISCO1
ISCO2 +
ISCO3 +
ISCO4
ISCO5
ISCO6
ISCO7
ISCO8
ISCO9

ISCO1 +
ISCO2 +
ISCO3 +
ISCO4 +
ISCO5 +
ISCO6 +
ISCO7 +
ISCO8 +
ISCO9 +

ISCO1 +
ISCO2 +
ISCO3 +
ISCO4 +
ISCO5 +
ISCO6 +
ISCO7 +
ISCO8 +
ISCO9 +

ISCO1
ISCO2 +
ISCO3
ISCO4
ISCO5 +
ISCO6 +
ISCO7 +
ISCO8 +
ISCO9 +

ISCO1 +
ISCO2 +
ISCO3 +
ISCO4 +
ISCO5 +
ISCO6 +
ISCO7 +
ISCO8 +
ISCO9 +

ISCO1 +
ISCO2 +
ISCO3
ISCO4
ISCO5 +
ISCO6
ISCO7 +
ISCO8 +
ISCO9 +

ISCO1 +
ISCO2 +
ISCO3 +
ISCO4 +
ISCO5 +
ISCO6 +
ISCO7 +
ISCO8 +
ISCO9 +

ISCO1
ISCO2 +
ISCO3 +
ISCO4 +
ISCO5 +
ISCO6
ISCO7
ISCO8 +
ISCO9 +

ISCO1 +
ISCO2 +
ISCO3 +
ISCO4 +
ISCO5 +
ISCO6
ISCO7 +
ISCO8 +
ISCO9

ISCO1 +
ISCO2 +
ISCO3 +
ISCO4 +
ISCO5 +
ISCO6 +
ISCO7 +
ISCO8 +
ISCO9 +

ISCO1 +
ISCO2 +
ISCO3
ISCO4 +
ISCO5 +
ISCO6
ISCO7 +
ISCO8 +
ISCO9 +

ISCO1
ISCO2 +
ISCO3
ISCO4
ISCO5 +
ISCO6
ISCO7 +
ISCO8 +
ISCO9 +

ISCO1
ISCO2 +
ISCO3 +
ISCO4 +
ISCO5 +
ISCO6 +
ISCO7 +
ISCO8 +
ISCO9 +

ISCO1 +
ISCO2 +
ISCO3 +
ISCO4
ISCO5
ISCO6
ISCO7
ISCO8
ISCO9

Research methodology

The methodology of this study is based on the construction of a composite indicator designed to measure the intensity of labour demand (ILD) in EU countries between 2010 and 2023. The approach relies on Eurostat data related to employment levels, total hours worked, and average working hours, combined with adjustments for absenteeism and educational structure.

The initial formula for measuring ILD was based on total working hours and is expressed as:

ILD = P × H × D

where:
P – number of people employed in the economy,
H – average number of hours worked per day,
D – number of working days in a year.

In the next phase, the indicator was refined by incorporating average absence rates (A) among workers, resulting in a new formula:

ILD2 = P × H × D × (1 − A)

where:
A – average percentage rate of absence from work in a given year.

To capture the educational and occupational structure of the workforce, the final indicator (ILD3) uses disaggregated data by ISCED education levels and ISCO-08 occupational categories. The adjusted formula is:

ILD3 = PEC × H × D × (1 − A)

where:
PEC – number of people employed by education level (ISCED) and occupation (ISCO-08),
H – average number of hours worked per day,
D – number of working days in a year,
A – average absence rate.

To analyse relative change over time, ILD3 was expressed as a fixed-base index with 2010 as the base year (y₁), using the formula:

ILD3t / ILD32010

All ILD3 values were calculated for 24 EU countries (excluding Luxembourg, Slovakia, and Greece) using ISCO-08's 9 major occupational groups and ISCED education levels. Armed Forces Occupations were excluded due to data unavailability.

Conclusions

The conducted analysis confirmed that labour markets in EU countries between 2010 and 2023 exhibited clear trends in the intensity of labour demand (ILD3), differentiated by level of education and occupational structure. The indicator made it possible to assess long-term shifts in demand across ISCO-08 occupational groups and ISCED education levels. Its application to data from 24 EU countries revealed a strong upward trend in demand for workers with higher education, observable across nearly all occupational groups regardless of ISCO-08 classification.

Interestingly, even in occupational groups traditionally not requiring high-level qualifications—such as Elementary Occupations (ISCO 9)—there was an increase in labour demand for individuals with higher education. This suggests that employers increasingly value broader competencies, adaptability, and the potential for internal mobility that higher education brings, regardless of the job's formal skill level. In contrast, individuals with secondary education (ISCED 3–4) were more frequently subject to declining trends. Negative or indeterminate labour demand trajectories affected approximately 27% of the observations in this group, while only 4% of observations for higher education graduates indicated a declining trend.

These results offer clear evidence in support of a structural shift in labour market preferences towards more highly educated workers. Acquired skills, greater adaptability, and the ability to work in technologically advanced environments strengthen the labour market position of this group. Consequently, the research findings contradict the initial hypothesis that the changes that have occurred on the labour market in recent years are reducing demand from businesses for employees with higher education. On the contrary, the results indicate a steady and widespread increase in demand for this category of workers across all major occupational areas.

References

  • Acemoglu, D., & Restrepo, P. (2019). Automation and new tasks: How technology displaces and reinstates labor. Journal of Economic Perspectives, 33(2), 3–30.
  • Baran, B. (2020). Studenci a wymagania rynku pracy. Raport nt. preferencji pracodawców względem umiejętności swoich potencjalnych pracowników młodego pokolenia. Stowarzyszenie KoLiber.
  • Biagi, F., Castaño Muñoz, J., & Di Pietro, G. (2020). Mismatch between demand and supply among higher education graduates in the EU. EUR 30121 EN, Publications Office of the European Union. https://doi.org/10.2760/003134
  • Charles, L., Xia, S., & Coutts, A. P. (2022). Digitalization and employment: A review. International Labour Organization.
  • Chemlal, O., & Benomar, W. (2024). The technological impact on employment in Spain between 2023 and 2035. Forecasting, 6, 296–325. https://doi.org/10.3390/forecast6020017
  • Chen, Q. (2023). Similarities between cycles in China’s hog futures market and cycles in the labor market. Advances in Economics, Management and Political Sciences, 25, 298–303.
  • Eurostat. (2023). Employment and labour demand. https://ec.europa.eu/eurostat
  • Eurostat. (2023b). Glossary: International Standard Classification of Education (ISCED). https://ec.europa.eu/eurostat
  • Eurostat. (2024a). Average number of usual weekly hours of work. https://ec.europa.eu/eurostat
  • Eurostat. (2024b). Employment (thousand hours worked) by NUTS 2 regions. https://ec.europa.eu/eurostat
  • Eurostat. (2024c). Employment by sex, age, occupation and educational attainment level. https://ec.europa.eu/eurostat
  • Eurostat. (2024d). Glossary: International Standard Classification of Occupations (ISCO). https://ec.europa.eu/eurostat
  • Fajaryati, N., Budiyono, Akhyar, M., & Wiranto. (2020). The employability skills needed to face the demands of work in the future: Systematic literature reviews. Open Engineering, 10(1), 595–603. https://doi.org/10.1515/eng-2020-0072
  • Fossen, F. M., & Sorgner, A. (2019). New digital technologies and heterogeneous employment and wage dynamics. IZA DP No. 12242.
  • Future of Jobs Report. (2023). Insight Report. World Economic Forum.
  • Ghodsi, M., Ivanović, K., Leitner, S., Beckers, P., & de Lange, T. (2024). The impact of migration to the EU on labour shortages in the Western Balkans. GS4S Report. https://doi.org/10.13140/RG.2.2.29350.95049/1
  • Gogoi, A. (2023). The impact of globalization on labour market with focus on wage inequality and job displacement. Theoretical and Applied Economics, 3(636), 333–342.
  • Guznajeva, T., Gutierrez, J. G., Konstantynova, A., Zeqo, K., Nausedaite, R., & Kooijmans, O. (2022). PILLARS – Pathways to inclusive labour markets.
  • International Labour Organization. (2024). Classification of occupation. https://ilostat.ilo.org
  • Kozek, W. (2014). Rynek pracy. Perspektywa instytucjonalna. Wydawnictwo Uniwersytetu Warszawskiego.
  • Krause, A., Rinne, U., & Zimmermann, K. F. (2014). How far away is a single European labor market? IZA Discussion Paper No. 8383.
  • Kryńska, E., & Kwiatkowski, E. (2013). Podstawy wiedzy o rynku pracy. Wydawnictwo Uniwersytetu Łódzkiego.
  • Księżyk, M. (2005). Globalizacja a rynek pracy. Nierówności Społeczne a Wzrost Gospodarczy, 6, 287–302.
  • Lauder, H., & Mayhew, K. (2020). Higher education and the labour market: An introduction. Oxford Review of Education, 46(1), 1–9. https://doi.org/10.1080/03054985.2019.1699714
  • Lazarova, L. B., et al. (2022). Trends in the development of the labour market in the context of economic modernization. https://doi.org/10.56199/dpcsebm.mzhe4288
  • Majewska, M., & Samol, S. (2016). Rozwój elastycznego rynku pracy. Wydawnictwo Naukowe UAM.
  • Miciuła, I., Rogowska, K., & Wojtaszek, H. (2021). The labor market and its influence on shaping the business. Information Technology and Management, 12449–12455.
  • Mihaylov, E., & Tijdens, K. G. (2019). Measuring task content of ISCO-08 occupations. Tinbergen Institute Discussion Paper, TI 2019-035/IV.
  • OECD. (2019). Policy responses to new forms of work. OECD Publishing. https://doi.org/10.1787/0763f1b7-en
  • OECD. (2023). Education at a glance 2023: OECD indicators. OECD Publishing. https://doi.org/10.1787/e13bef63-en
  • Pater, R., Cherniaiev, H., & Arendt, Ł. (2024). Demand for skills in AI-related occupations. In L. Baltina & T. Hogarth (Eds.), Re-thinking Europe’s Skill Needs. Fondazione Giacomo Brodolini.
  • Přívara, A., Masárová, T., & Tupá, M. (2023). Migration and labour market competitiveness: The case of EU. Journal of Competitiveness, 15(1), 131–145.
  • Radulović, M., & Kostić, M. (2020). Globalization and economic growth in Eurozone economies. Zbornik radova Ekonomskog fakulteta u Rijeci, 38(1), 183–214.
  • Savona, M., Ciarli, T., Steinmueller, W. E., & Vannuccini, S. (2022). The design of digital automation technologies. EconPol Forum, 23(5), 4–10.
  • Sobocka-Szczapa, H. (2021). Recruitment of employees – assumptions of the risk model. Risks, 9(3), 55. https://doi.org/10.3390/risks9030055
  • Ray, T. K. (2022). Work-related well-being and subjective well-being. Industrial Health, 60(3), 242–252. https://doi.org/10.2486/indhealth.2021-0122
  • International Standard Classification of Occupations (ISCO-08). (2023). 21st ICLS, Geneva.
  • U.S. Department of the Treasury. (2022). The state of labor market competition.